Launch configuration and occupancy
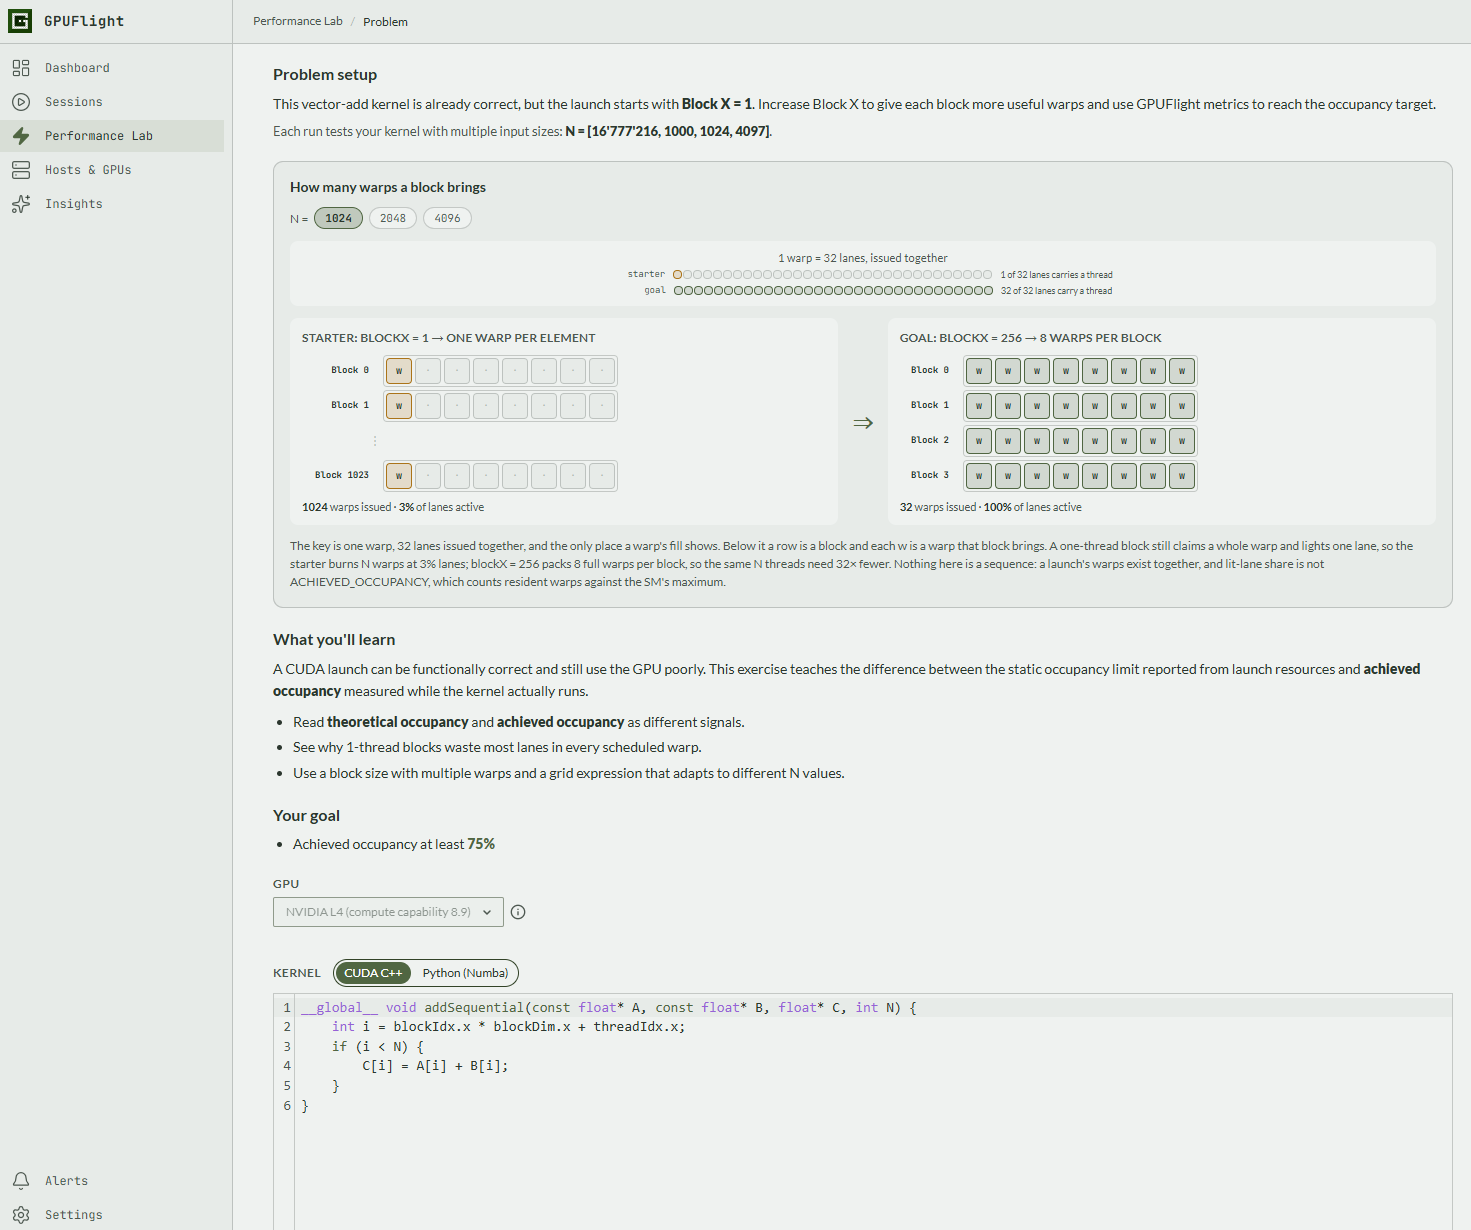
See how block size, active warps, registers, and shared memory shape the work available to each SM.
GPUFlight Performance Lab
Performance Lab turns CUDA optimization concepts into guided experiments. Change a kernel or launch configuration, run it on managed NVIDIA hardware, and use measured profiling evidence to explain what improved—and what did not.
Learn by measuring
CUDA performance advice is easy to memorize and easy to misuse. Higher occupancy does not automatically mean a faster kernel. Shared memory can reduce global-memory traffic, but bank conflicts can introduce a different bottleneck. Asynchronous work can overlap, but only when dependencies and synchronization allow it.
Each lab gives you a constrained problem, an explicit target, editable code or launch parameters, and profiling views that expose the relevant behavior. The goal is not just to produce a passing answer. It is to understand why the measured result changed.
Curriculum
Start with execution fundamentals, then progress toward memory, concurrency, and modern GPU kernels.
See how block size, active warps, registers, and shared memory shape the work available to each SM.
Compare access patterns and connect memory transactions to useful bytes and effective bandwidth.
Change shared-memory indexing and see how bank conflicts serialize requests inside a warp.
Investigate branch behavior and understand when lanes in the same warp follow different paths.
Move from shared-memory reductions toward register exchange with warp shuffle operations.
Reason about kernel concurrency, memory transfers, synchronization, and timeline overlap.
Explore tiled matrix multiplication, data reuse, WMMA, and hardware acceleration.
Connect high-level framework operations to kernels, transfers, synchronization, and GPU execution.
The experiment loop
Every exercise follows the same performance-engineering habit.
Understand the correctness constraint, performance question, and metric you are trying to change.
Edit the CUDA kernel or launch configuration while preserving the required behavior.
Compile and execute in an isolated managed environment with the required profiling passes.
Use output, timings, metrics, source correlation, and timelines to support the conclusion.
A profiler, not a quiz grader
A conventional coding exercise can verify output and execution time. Performance Lab can also connect the result to achieved occupancy, memory efficiency, kernel launches, source and SASS instructions, sampled stall evidence, and the GPU timeline—depending on the lesson and available profiling mode.
When you are ready to investigate your own CUDA program, move from the guided lesson into the GPUFlight CUDA Playground and keep the same evidence-driven workflow.

Common questions
No. The lab runs code on GPUFlight's managed NVIDIA hardware, so your computer only needs a supported browser.
Performance Lab focuses on how CUDA programs execute and why their performance changes. Some exercises are beginner-friendly, while later chapters assume basic CUDA C++ familiarity.
No. Lab runs compile and execute on real NVIDIA GPU hardware. Results can still vary slightly because physical systems have normal measurement noise.
Yes. The target guides the exercise, but editable labs are designed for additional experiments as long as correctness and sandbox constraints are preserved.
Start with one measured change
Open the vector-add occupancy exercise or browse the complete lab catalog after signing in.