Everything you need to understand and optimize your GPUs

From kernel-level profiling to fleet-wide monitoring for AI training, inference, and production workloads.

Kernel Profiling

Automatic GPU kernel instrumentation for NVIDIA (CUPTI) and AMD (ROCm). Capture execution time, occupancy, register usage, and the launches slowing down your pipeline.

SASS Disassembly

GPU instruction-level analysis with PC Sampling and SASS metrics. See exactly where your kernels spend cycles, down to individual assembly instructions.

Measured Occupancy

Hardware-measured achieved occupancy for every kernel via kernel replay, not just the theoretical limit. Plus SM throughput, L1/L2 hit rates, and DRAM traffic per kernel.

Multi-Pass Profiling

One command runs tracing, PC sampling, SASS, and kernel replay as isolated passes, then merges them into a single analysis. Deep metrics without polluting your timings.

Real-time Monitoring

Always-on GPU utilization, temperature, power, memory, and fan speed tracking via NVML. Sub-second resolution. Negligible host-side overhead, safe to leave on 24/7.

Kernel Timeline + PM Sampling

Zoomable per-stream timeline of every kernel launch and memory transfer, with GPU performance-counter samples overlaid so hardware activity lines up with the code that caused it.

Logical Scoping

Group kernels by training epoch, inference batch, or any logical boundary with GFL_SCOPE. See exactly which code path launched each kernel and compare the stages that drive GPU cost.

Fleet Overview

Monitor all GPUs across your cluster in one dashboard. Per-host, per-device views with stale session detection and thermal health gauges.

AI Insights

Automatic detection of low occupancy, memory bottlenecks, and suboptimal kernel configurations. Actionable recommendations for faster GPU and AI pipelines, not just data.

A closer look at the product workflows

Detailed profiling, SASS analysis, monitoring, and fleet management live together on the same product path.

Kernel-level visibility

GPUFlight captures every GPU kernel launch via CUPTI for NVIDIA and ROCTracer for AMD. For each kernel, you get execution time, grid and block dimensions, register usage, shared memory, occupancy breakdown, and the limiting resource. With a kernel-replay pass, theoretical occupancy is joined by measured achieved occupancy from the hardware itself. No sampling bias, no missed launches.

Instruction-level profiling

Go deeper with PC Sampling and SASS metrics. See which GPU assembly instructions cause stalls, identify memory bottlenecks at the warp level, and understand divergence patterns. All without recompiling your kernels.

GPUFlight Source and SASS instruction analysis view SASS disassembly interleaved with CUDA source, with per-line stall heat from PC sampling.

Memory access analysis

Every memory instruction is scored by access pattern. Coalescing efficiency, cache line utilization, and wasted-bandwidth detection surface the exact load or store burning DRAM sectors, with a plain-English recommendation for how to fix it.

GPUFlight memory access analysis showing 100 percent coalescing efficiency and per-instruction sector counts SASS-derived coalescing efficiency, sector counts, and access patterns for every memory instruction.

Automatic insights

GPUFlight does not just hand you raw numbers. Every session is scanned for divergence, low occupancy, stall hot spots, and memory inefficiencies, then ranked by severity with direct links to the source file, line, and PC offset. Findings, not dashboards.

GPUFlight light session insights view with detected issues Warp-stall breakdown and auto-detected issues, ranked by severity with the triggering metrics attached.

Always-on monitoring

The monitoring daemon collects GPU utilization, temperature, power draw, memory usage, and fan speed via NVML at sub-second intervals. Zero overhead on your compute workload. See trends across hours or days.

Fleet management

Monitor all GPUs across your cluster from one dashboard. Per-host summaries, per-device drill-downs, stale session detection, and thermal health gauges. Know exactly which machines need attention.

Multi-pass analysis groups

Deep profiling normally distorts the thing you are measuring. GPUFlight runs each collection mode (tracing, PC sampling, SASS metrics, and kernel replay) as its own isolated pass and merges the results into one session, so exact timings and hardware-measured metrics coexist in the same view.

Transparent ingestion

Uploads are tracked end to end: every session walks through uploading, ingesting, finalizing, and ready, with per-upload job rows and timing on the Uploads page. If something fails, you see the error, not a session that silently never appears.

Up and running in 5 minutes

Three steps. No complex setup. No agents hogging your GPU.

1

Profile Any App: No Code Changes

The gpufl launcher traces any CUDA program as-is, PyTorch included. Add extra passes for deep, hardware-measured metrics.

# Trace a run and upload it when it exits
gpufl trace --upload -- python train.py

# Go deeper: add an isolated kernel-replay pass
# (measured achieved occupancy, cache hit rates)
gpufl trace --passes=Trace,RangeProfilerKernelReplay -- ./my_app
2

Or Instrument with the SDK

Prefer explicit control? One include, one init call, and wrap the phases you care about with GFL_SCOPE.

#include <gpufl/gpufl.hpp>

int main() {
    gpufl::init({ .app_name = "my-training-job" });

    GFL_SCOPE("Forward Pass") {
        myKernel<<<grid, block>>>(...);
    }

    gpufl::shutdown();
    gpufl::generateReport();  // prints to stdout
}
3

Deploy and Monitor

Run the agent alongside your workload to stream data to the dashboard.

# Stream profiling data to GPUFlight Cloud
docker run -d   -v /tmp/gpufl:/var/log/gpufl   -e GPUFL_HTTP_TOKEN=your-api-key   gpuflight/agent:latest

# Or add always-on GPU monitoring
docker compose -f monitor.yml up -d

See GPUFlight in action

Product screenshots that show GPUFlight in action.

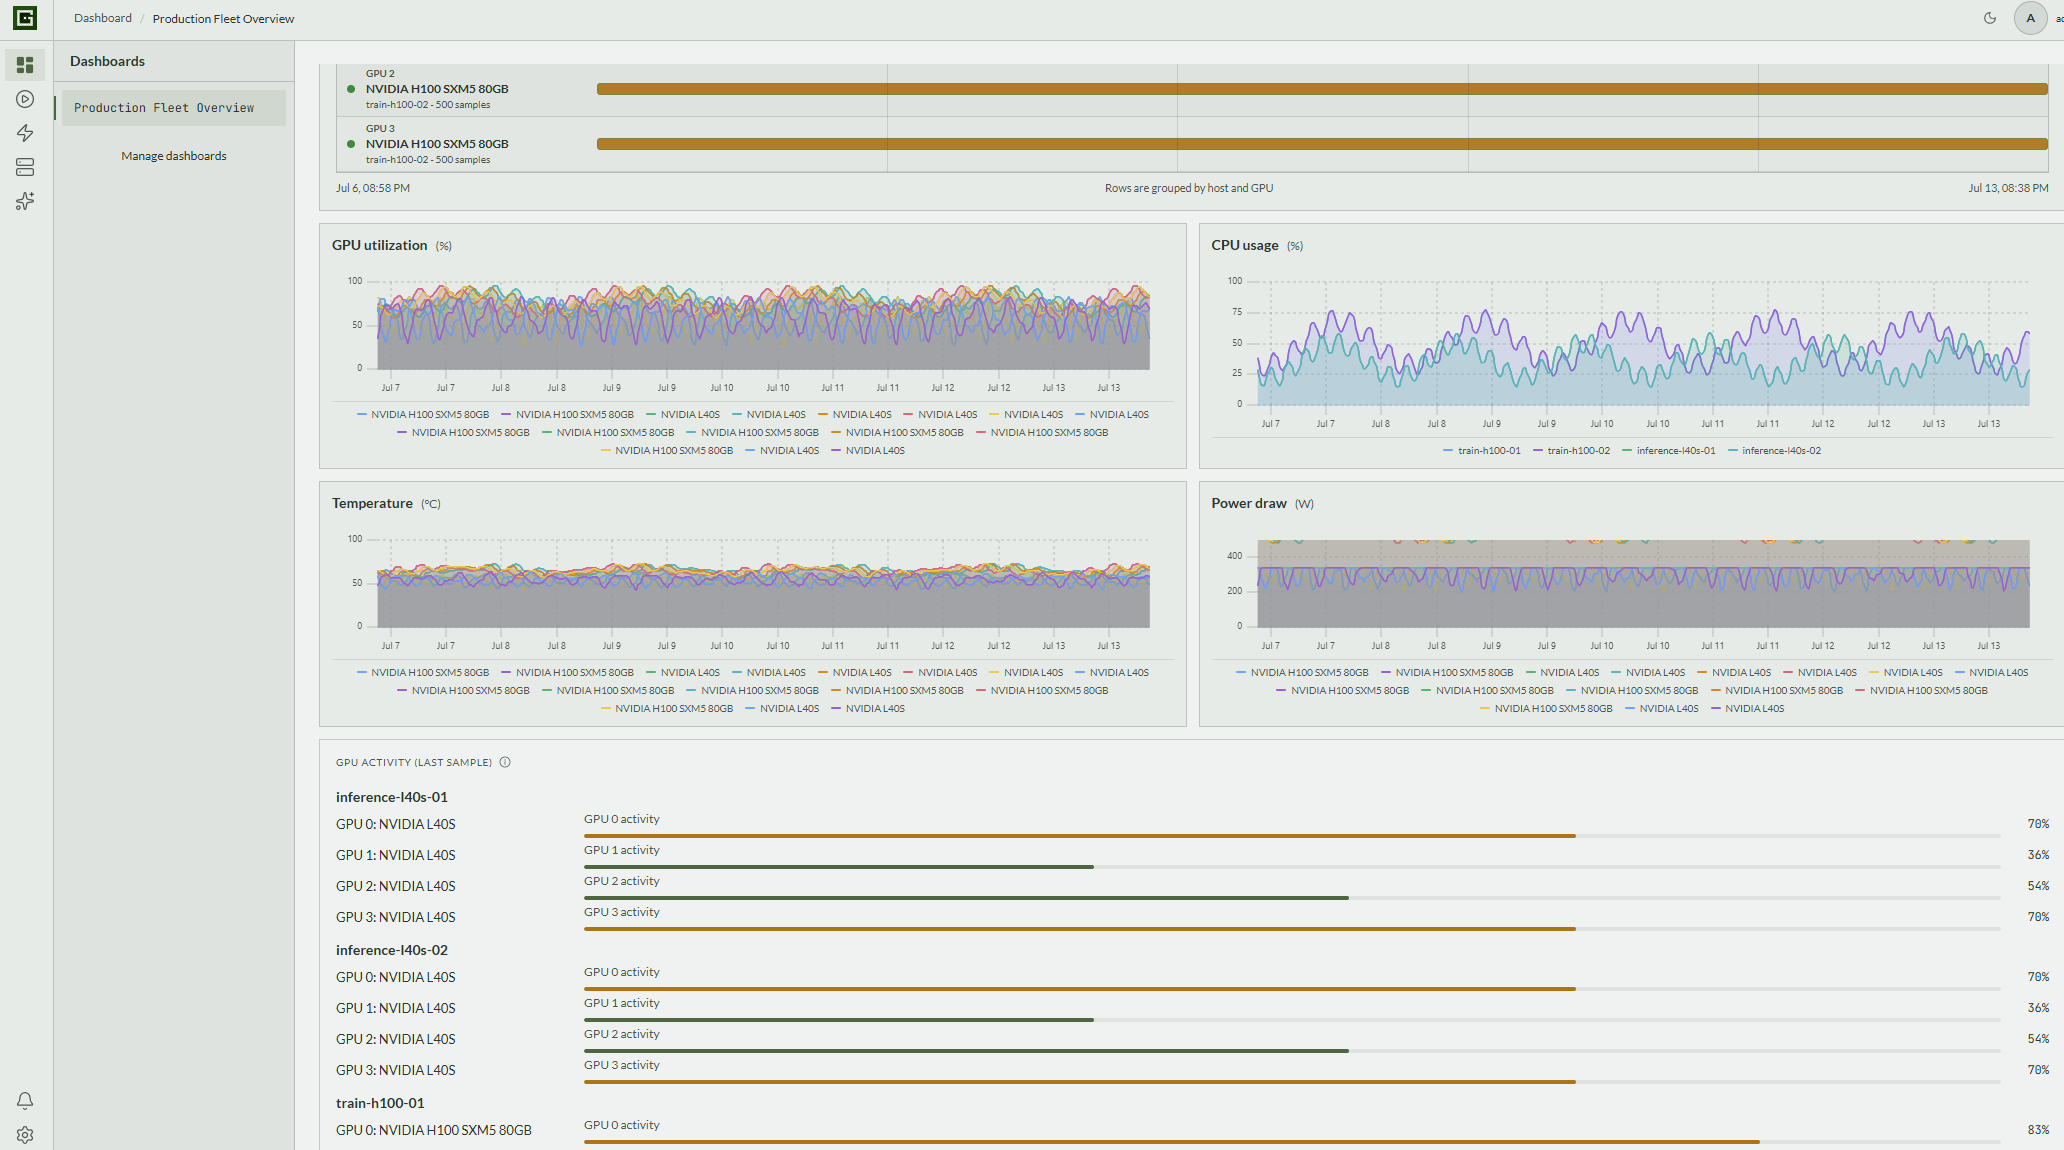
GPUFlight dashboard with GPU utilization, CPU usage, temperature, power draw, and per-GPU activity

Every fleet metric, aligned

Compare GPU utilization, CPU load, temperature, power draw, and per-GPU activity across the same time window to see how workload behavior affects the entire system.

  • GPU and CPU utilization side by side
  • Temperature and power trends across every device
  • Last-sample activity grouped by host and GPU
GPUFlight monitoring overview with activity timeline and metric charts

Monitoring that shows its gaps

The monitoring timeline distinguishes active, low-utilization, no-sample, and time-break intervals, so a quiet chart never hides a collector that silently stopped.

  • Range from 5 minutes to 7 days
  • Per-GPU rows grouped by host and device
  • Add or remove metric charts per view
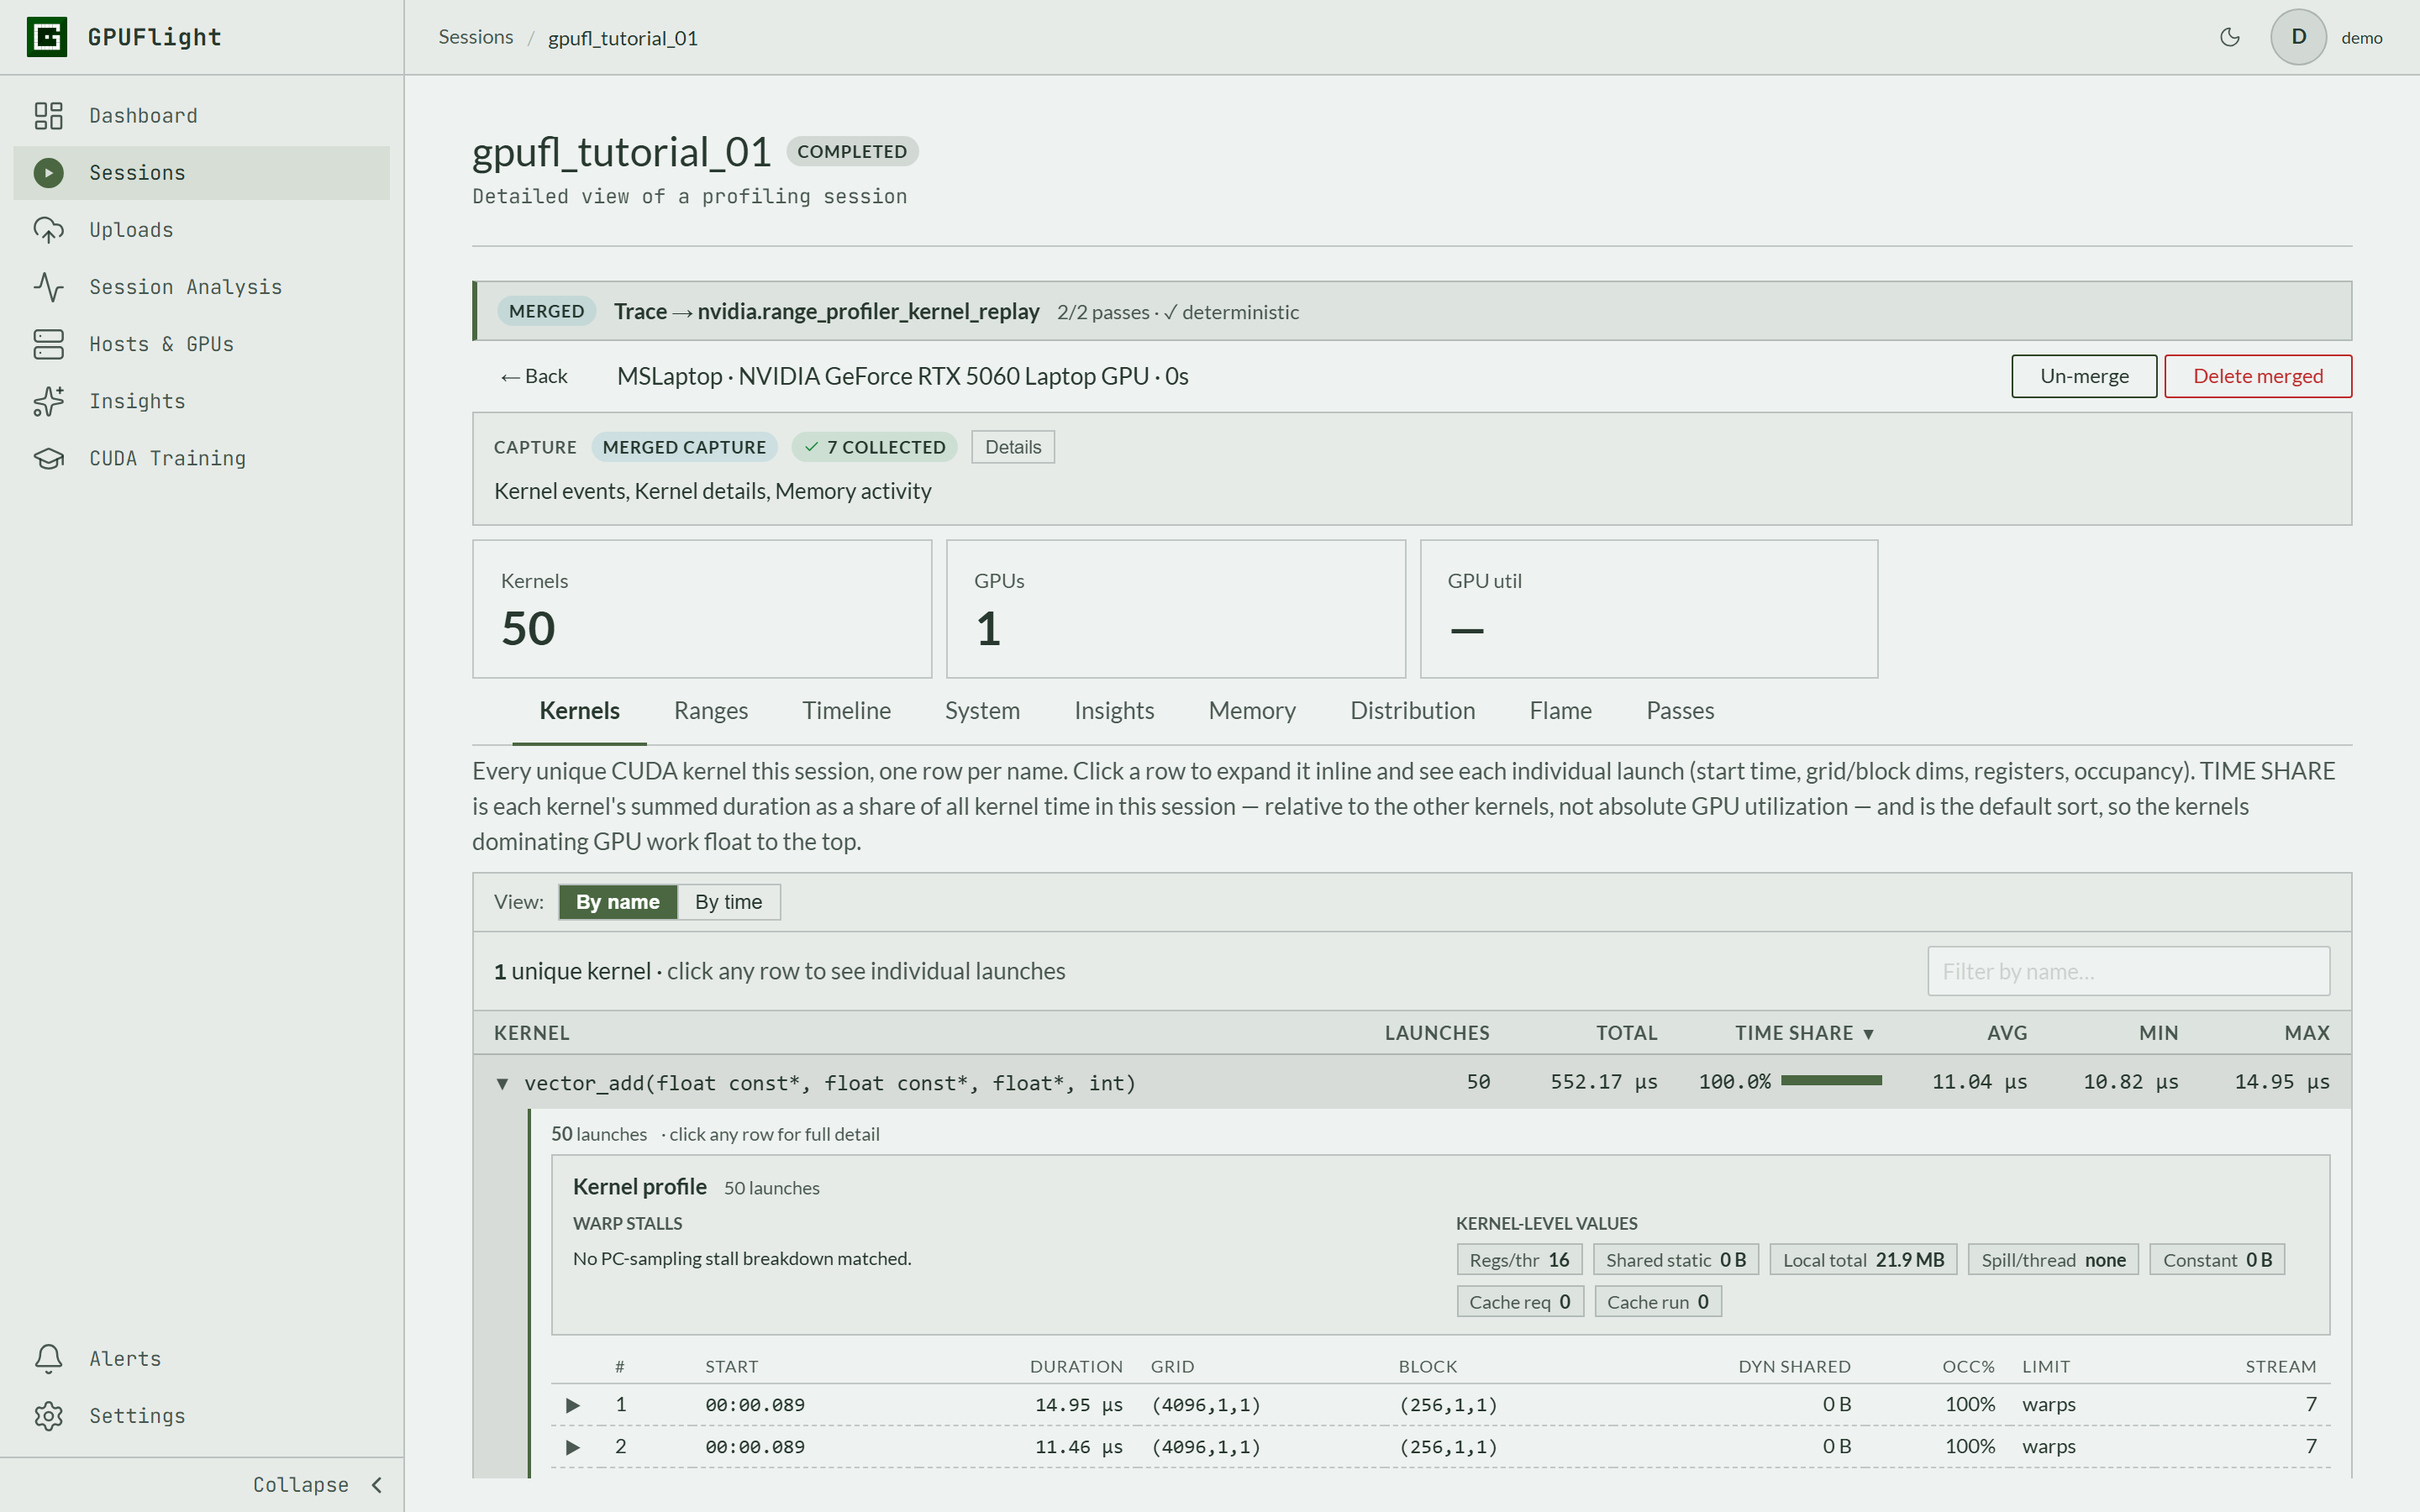
GPUFlight merged multi-pass profiling session with measured kernel metrics

Multi-pass profiling, one merged view

One command runs isolated profiling passes: kernel tracing plus hardware kernel replay. GPUFlight merges them into a single session view with exact timings and measured hardware metrics side by side.

  • Measured achieved occupancy for every kernel
  • Timing pass stays unpolluted by deep collection
  • Kernels, timeline, system, and insights tabs
GPUFlight kernel timeline with PM sampling metrics overlaid

Kernel timeline with hardware counters

Zoom into every kernel launch on a stream-by-stream timeline, with GPU performance-counter (PM) samples overlaid. Line up SM activity and memory throughput with the exact kernels that caused them.

  • Zoom and pan across the whole run
  • PM sampling lane aligned with kernel spans
  • Per-stream lanes with launch details on click
GPUFlight uploads page with ingestion job statuses

Watch your data land

Every upload is tracked through the ingestion pipeline: uploading, ingesting, finalizing, and ready. You always know whether a session is still processing or something needs attention.

  • Per-upload job rows with live status
  • End-to-end timing for each upload
  • Failures surface with an error, not silence

Built for GPU engineers

The profiling data you need to optimize training, inference, and production workloads without stopping them.

Dev to Prod

Deep kernel diagnostics during development. Continuous, low-overhead sampling in production. Same SDK and dashboard for local kernel tuning and deployed AI jobs.

Instruction-Level Detail

SASS disassembly, PC Sampling stall analysis, and memory coalescing efficiency, per instruction and per kernel.

Real-Time Dashboard

Live GPU metrics, kernel traces, and AI-powered insights streamed to a web dashboard as your code runs.

Fleet-Wide Visibility

Monitor every GPU across your cluster from one place. Per-host, per-device views with health gauges.

Simple, transparent pricing

Start free. Step up to Practice for uncapped labs and multi-pass Workbench, or scale to more GPUs, retention, and seats.

Free
$0

For exploring GPUFlight and occasional GPU practice.

  • Up to 3 GPUs
  • 1 GB / month data ingestion
  • 7-day retention
  • 1 team member
  • Performance Lab: daily run limit
  • Workbench: single-pass profiling (Trace)
Start free
Practice
$6.99 /month

For engineers and students building hands-on CUDA and GPU performance skills.

  • Up to 3 GPUs
  • 1 GB / month data ingestion
  • 7-day retention
  • 1 team member
  • Performance Lab: no daily run cap (fair use)
  • Workbench: 4-pass profiling (Trace, Range, SASS, PC Sampling)
Get started
Individual
$12.99 /month

For solo engineers profiling and optimizing real workloads.

  • Up to 8 GPUs
  • 5 GB / month data ingestion
  • 30-day retention
  • 1 team member
  • Performance Lab: no daily run cap (fair use)
  • Workbench: 4-pass profiling (Trace, Range, SASS, PC Sampling)
Get started
Team
$49.99 /month

For small engineering teams sharing GPU performance data and workflows.

  • Up to 32 GPUs
  • 30 GB / month data ingestion
  • 90-day retention
  • 5 team members
  • Performance Lab: no daily run cap (fair use)
  • Workbench: 4-pass profiling (Trace, Range, SASS, PC Sampling)
Get started
Enterprise
Contact us

For organizations needing custom scale, security, and support.

  • Custom GPU allocation
  • Custom data ingestion
  • Custom retention
  • Custom team size
  • Performance Lab: no daily run cap (fair use)
  • Workbench: 4-pass profiling (Trace, Range, SASS, PC Sampling)
Contact us
All plans include full GPU profiling (SASS + PC Sampling) and Insights. Need something custom? Talk to us.

Start profiling and monitoring in minutes

Free tier: 1 GB data ingestion per month. No credit card. NVIDIA or AMD.