Trace a CUDA command without source changes
Run an existing executable, Python program, or training command through the GPUFlight launcher and upload the completed profile.
gpufl trace --upload -- python train.pyCUDA application profiler
GPUFlight collects GPU execution data from CUDA applications and turns it into a browser-based investigation. Follow kernels across streams, inspect memory behavior, connect source to SASS, and keep lightweight traces separate from deeper replay passes.
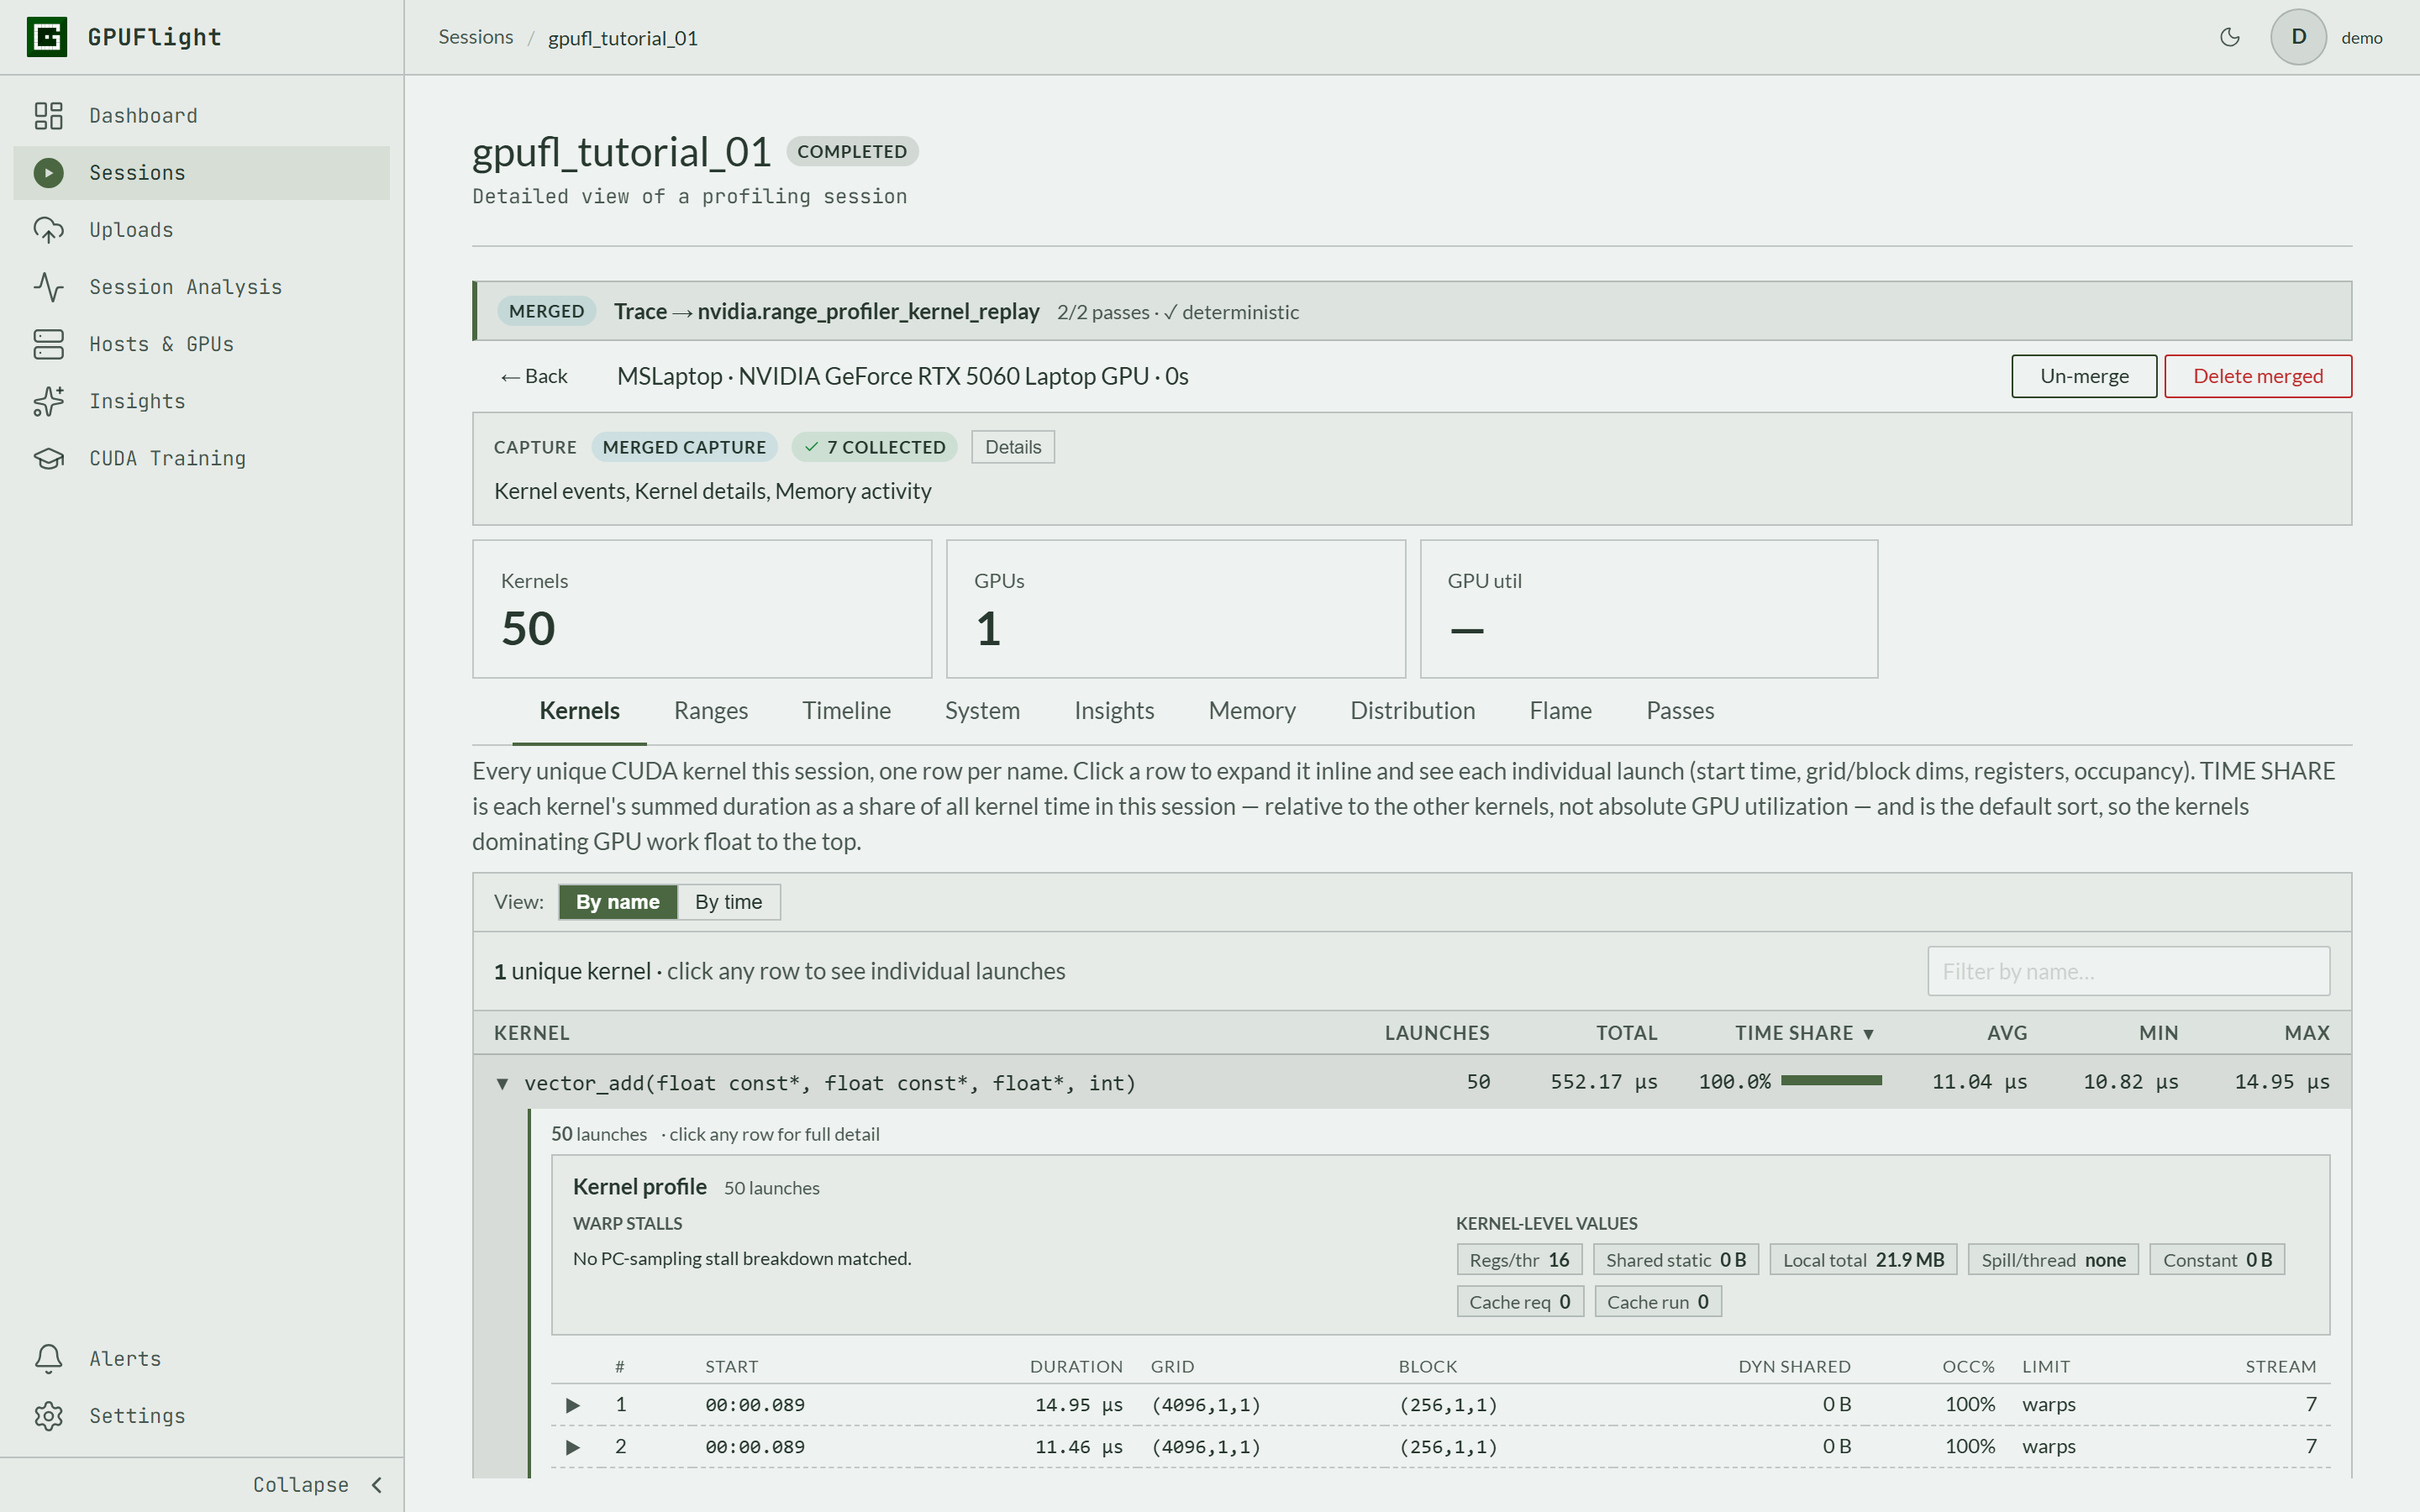
Profile without flattening the evidence
Detailed GPU counters are valuable, but collecting them can require kernel replay and change the timing characteristics of a run. GPUFlight keeps the low-overhead Trace pass as the timing anchor, then attaches metrics from isolated replay or sampling passes to the matching kernels and source locations.
This separation makes it clear which measurements describe the original execution timeline and which come from a deeper diagnostic pass. The merged session still gives you one investigation surface instead of a directory of unrelated profiler exports.
Collection paths
Choose the integration that matches the amount of control you need.
Run an existing executable, Python program, or training command through the GPUFlight launcher and upload the completed profile.
gpufl trace --upload -- python train.pyAdd scoped instrumentation when you want domain labels such as data loading, forward pass, inference, or postprocessing.
GFL_SCOPE("Forward Pass") {
  model.forward(input);
}
Kernel analysis
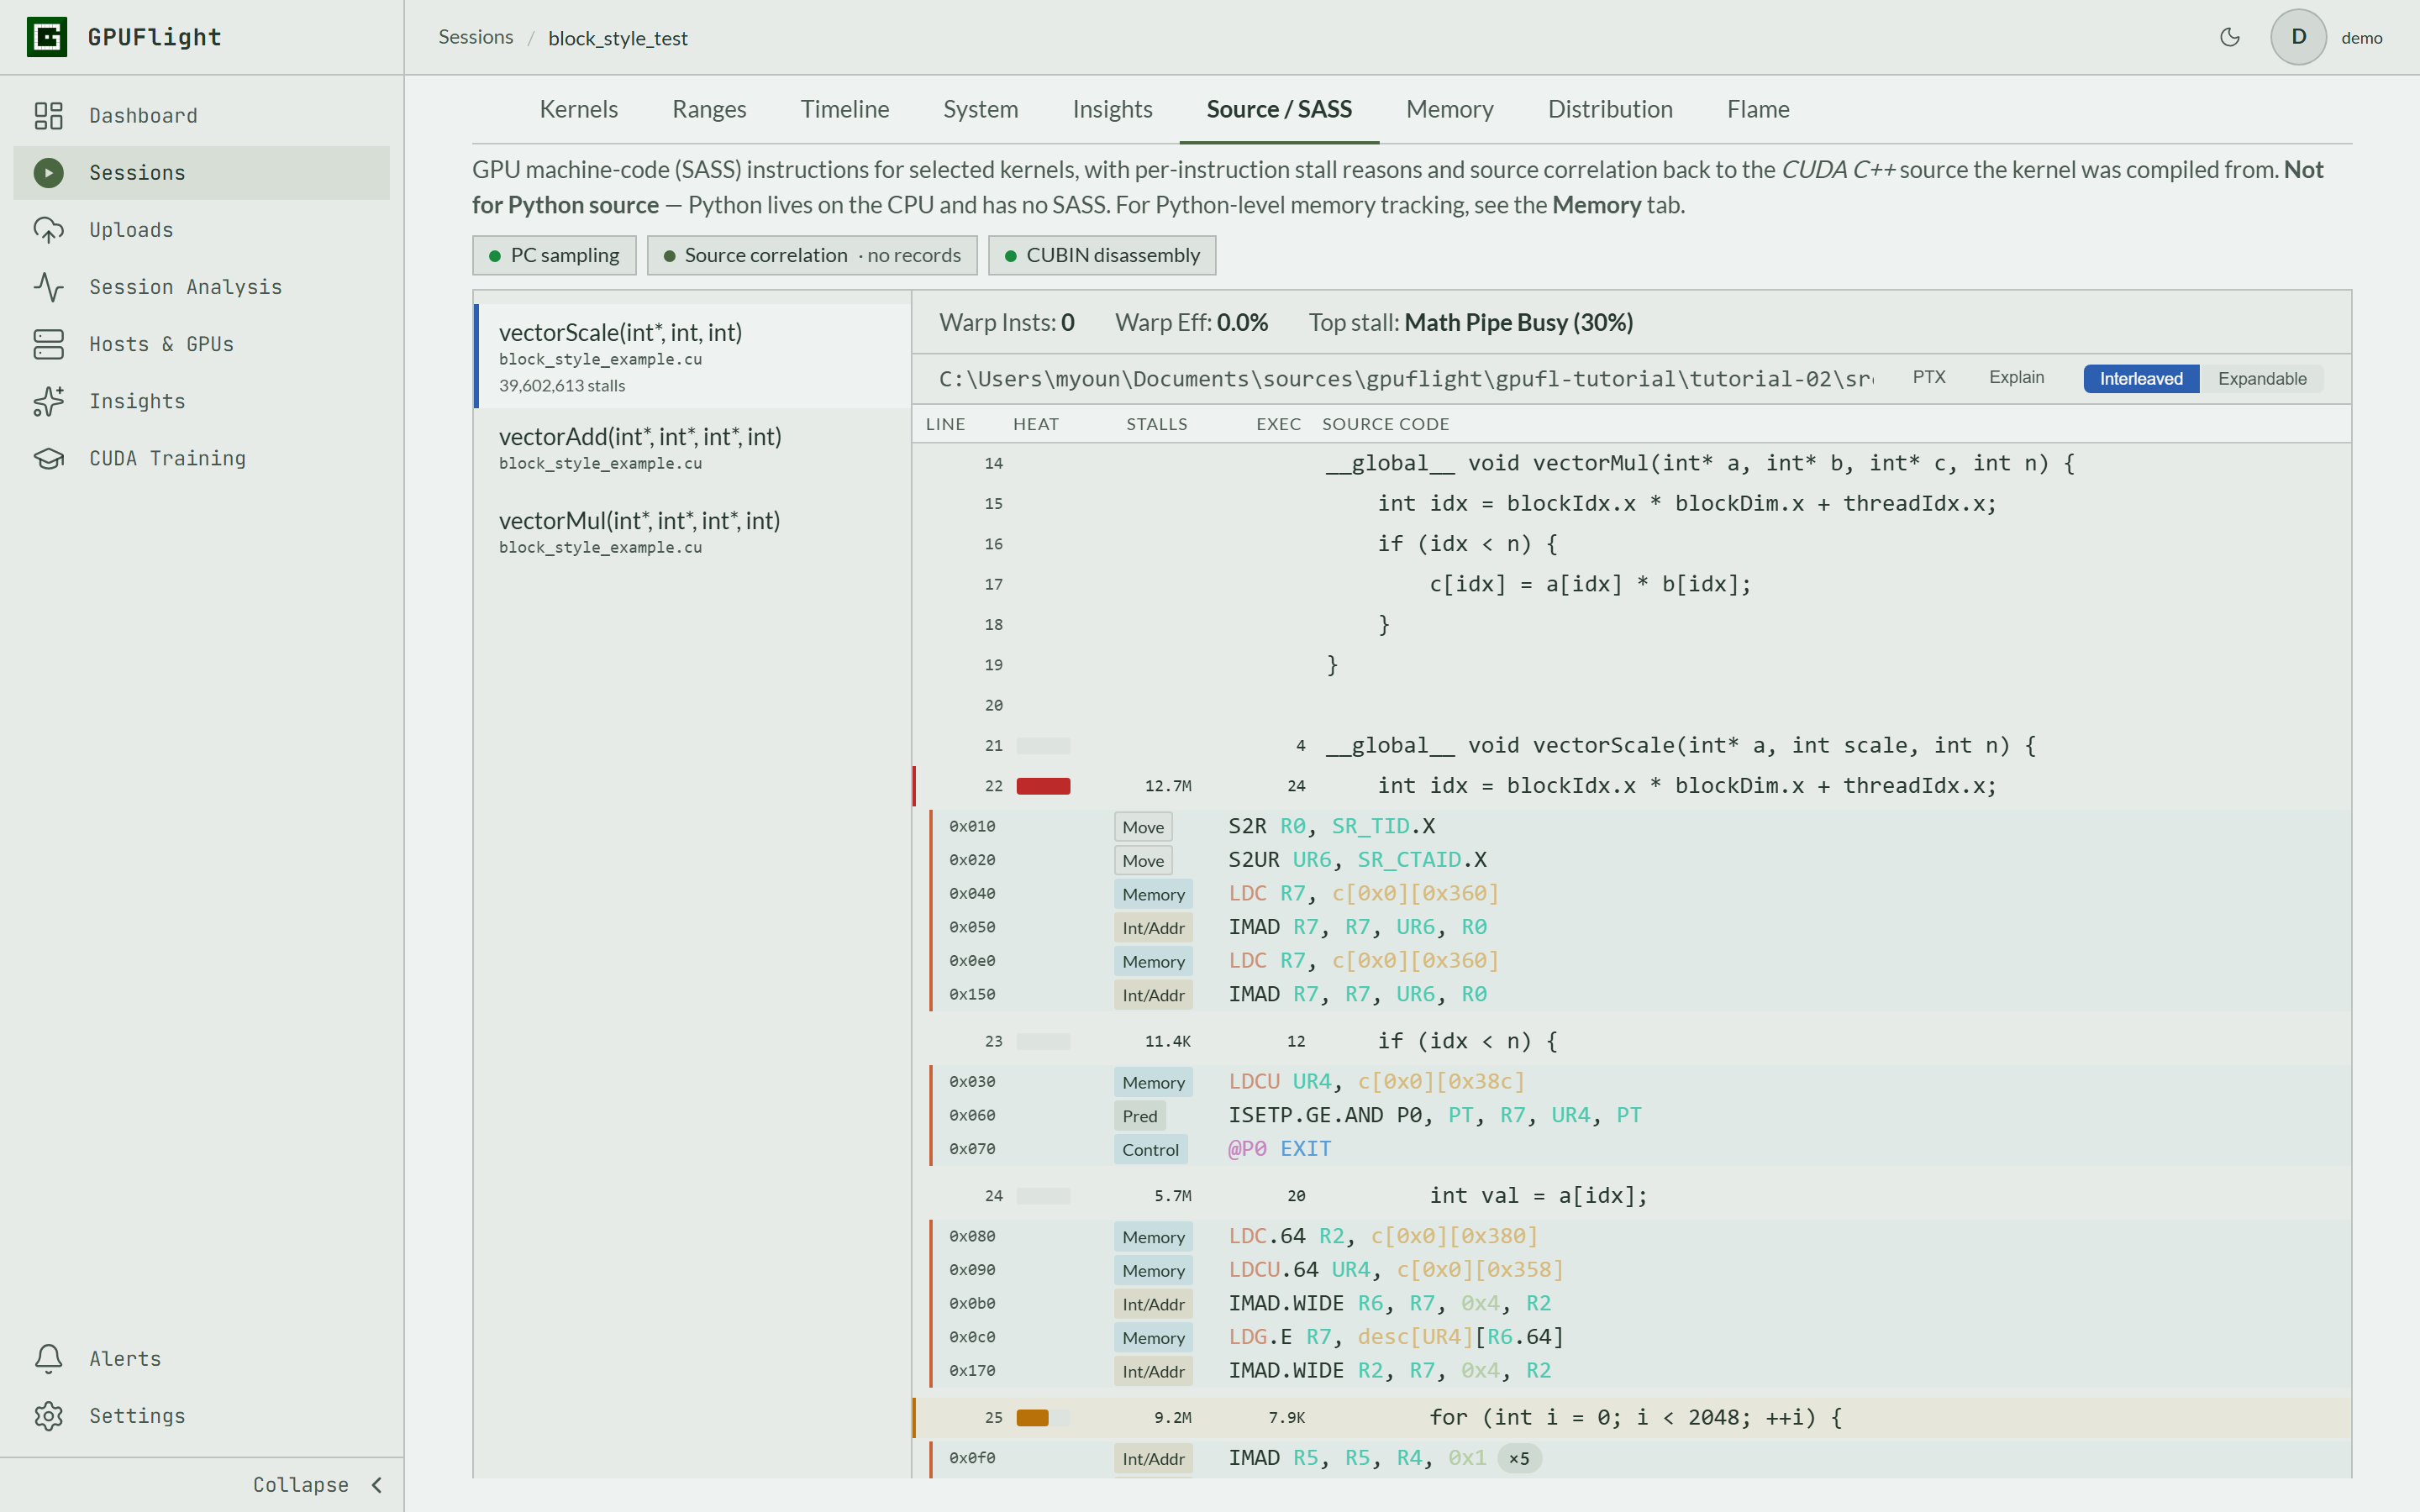
Start with the ordered kernel list or GPU timeline, then narrow the investigation. Depending on the collected passes, GPUFlight can expose launch configuration, achieved occupancy, cache and memory behavior, SASS instructions, source correlation, and sampled warp-stall evidence.
Application timeline
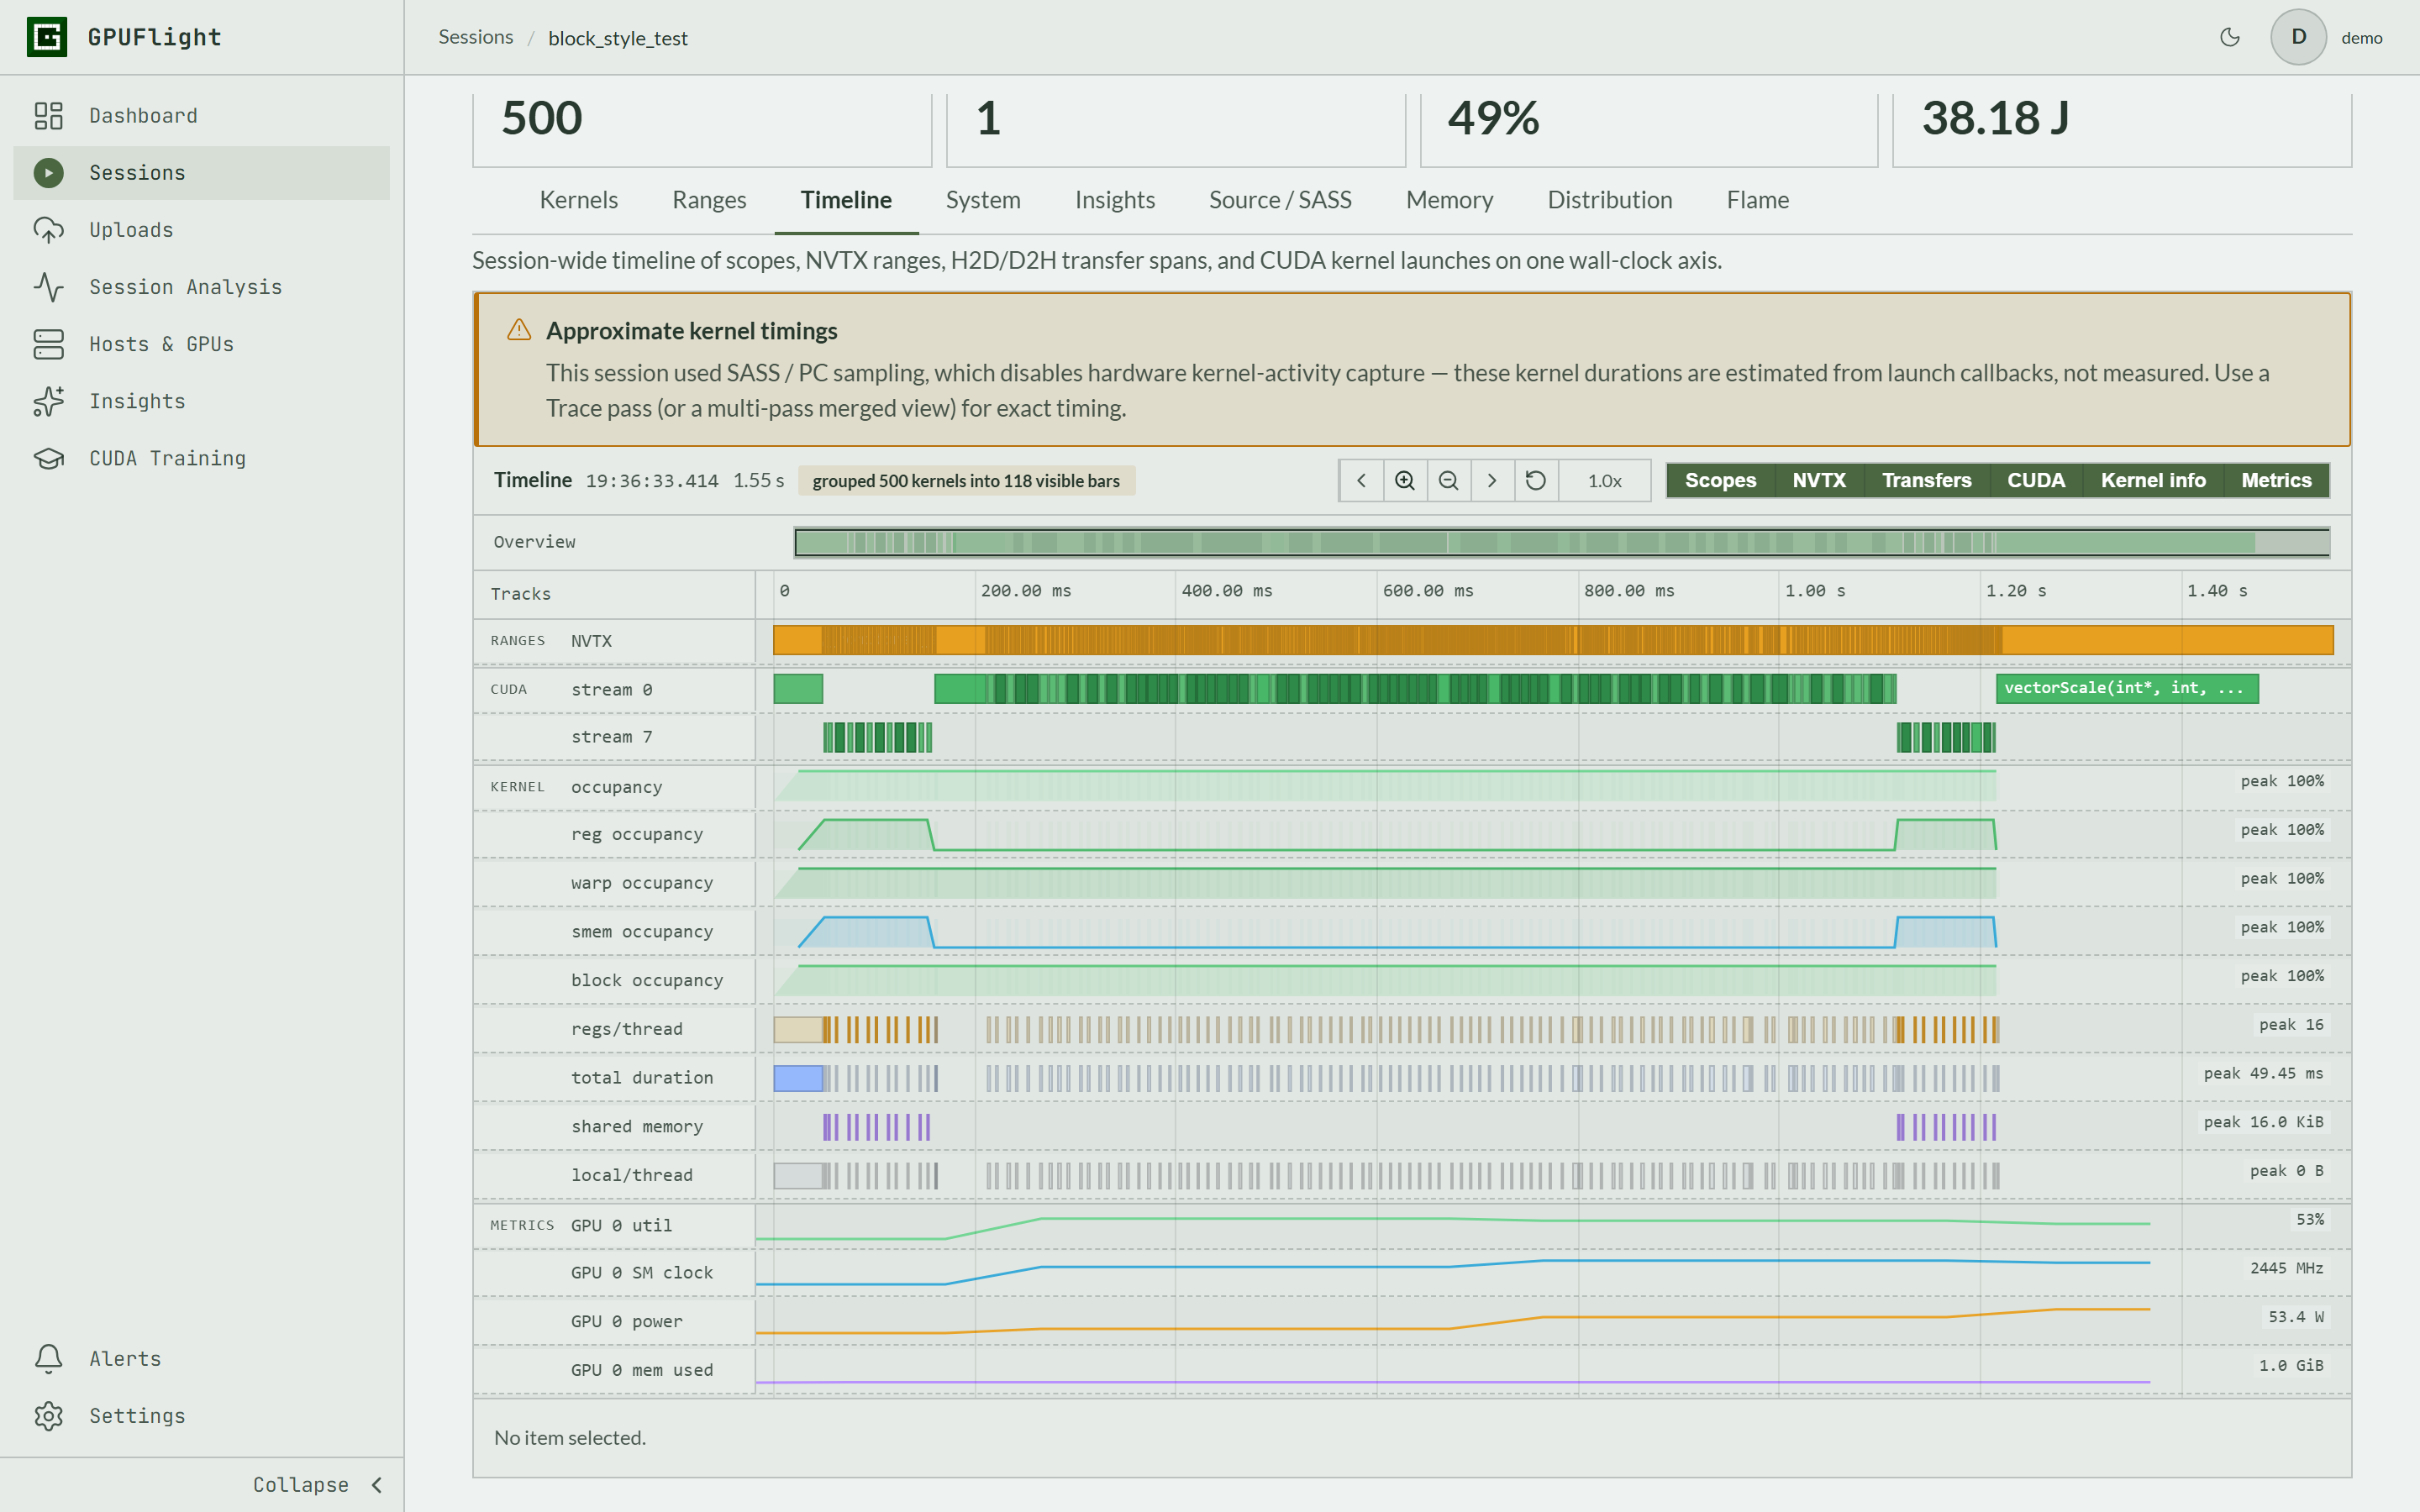
Kernel tables answer which operations were expensive. Timelines answer when they ran, where the gaps occurred, and whether expected concurrency or transfer overlap actually happened. GPUFlight aligns CUDA activity with application scopes and available system samples so the investigation can move between application structure and GPU behavior.
For a small editable reproduction, use the online CUDA Workbench. For guided optimization practice, start in Performance Lab.
Common questions
GPUFlight has a different workflow: collection from instrumented or launched workloads, upload, browser analysis, sharing, and fleet context. Nsight tools remain valuable for local, NVIDIA-specific development workflows.
Yes. The launcher can start Python applications, including PyTorch workloads, while the underlying CUDA activity is collected. What appears in a session depends on the workload and selected passes.
Deep hardware collection can require replay and perturb timing. Separate passes preserve a trustworthy trace timeline while still attaching deeper measurements to matching kernels.
GPUFlight also supports ROCm/HIP collection paths, but available metrics and views differ by vendor and collection capability.
Start with a trace
Create a free account, collect a session, and inspect the kernels and timeline in your browser.
Start profiling