GPU utilization
See how consistently each device performs useful work and where activity is uneven.
GPU fleet monitoring
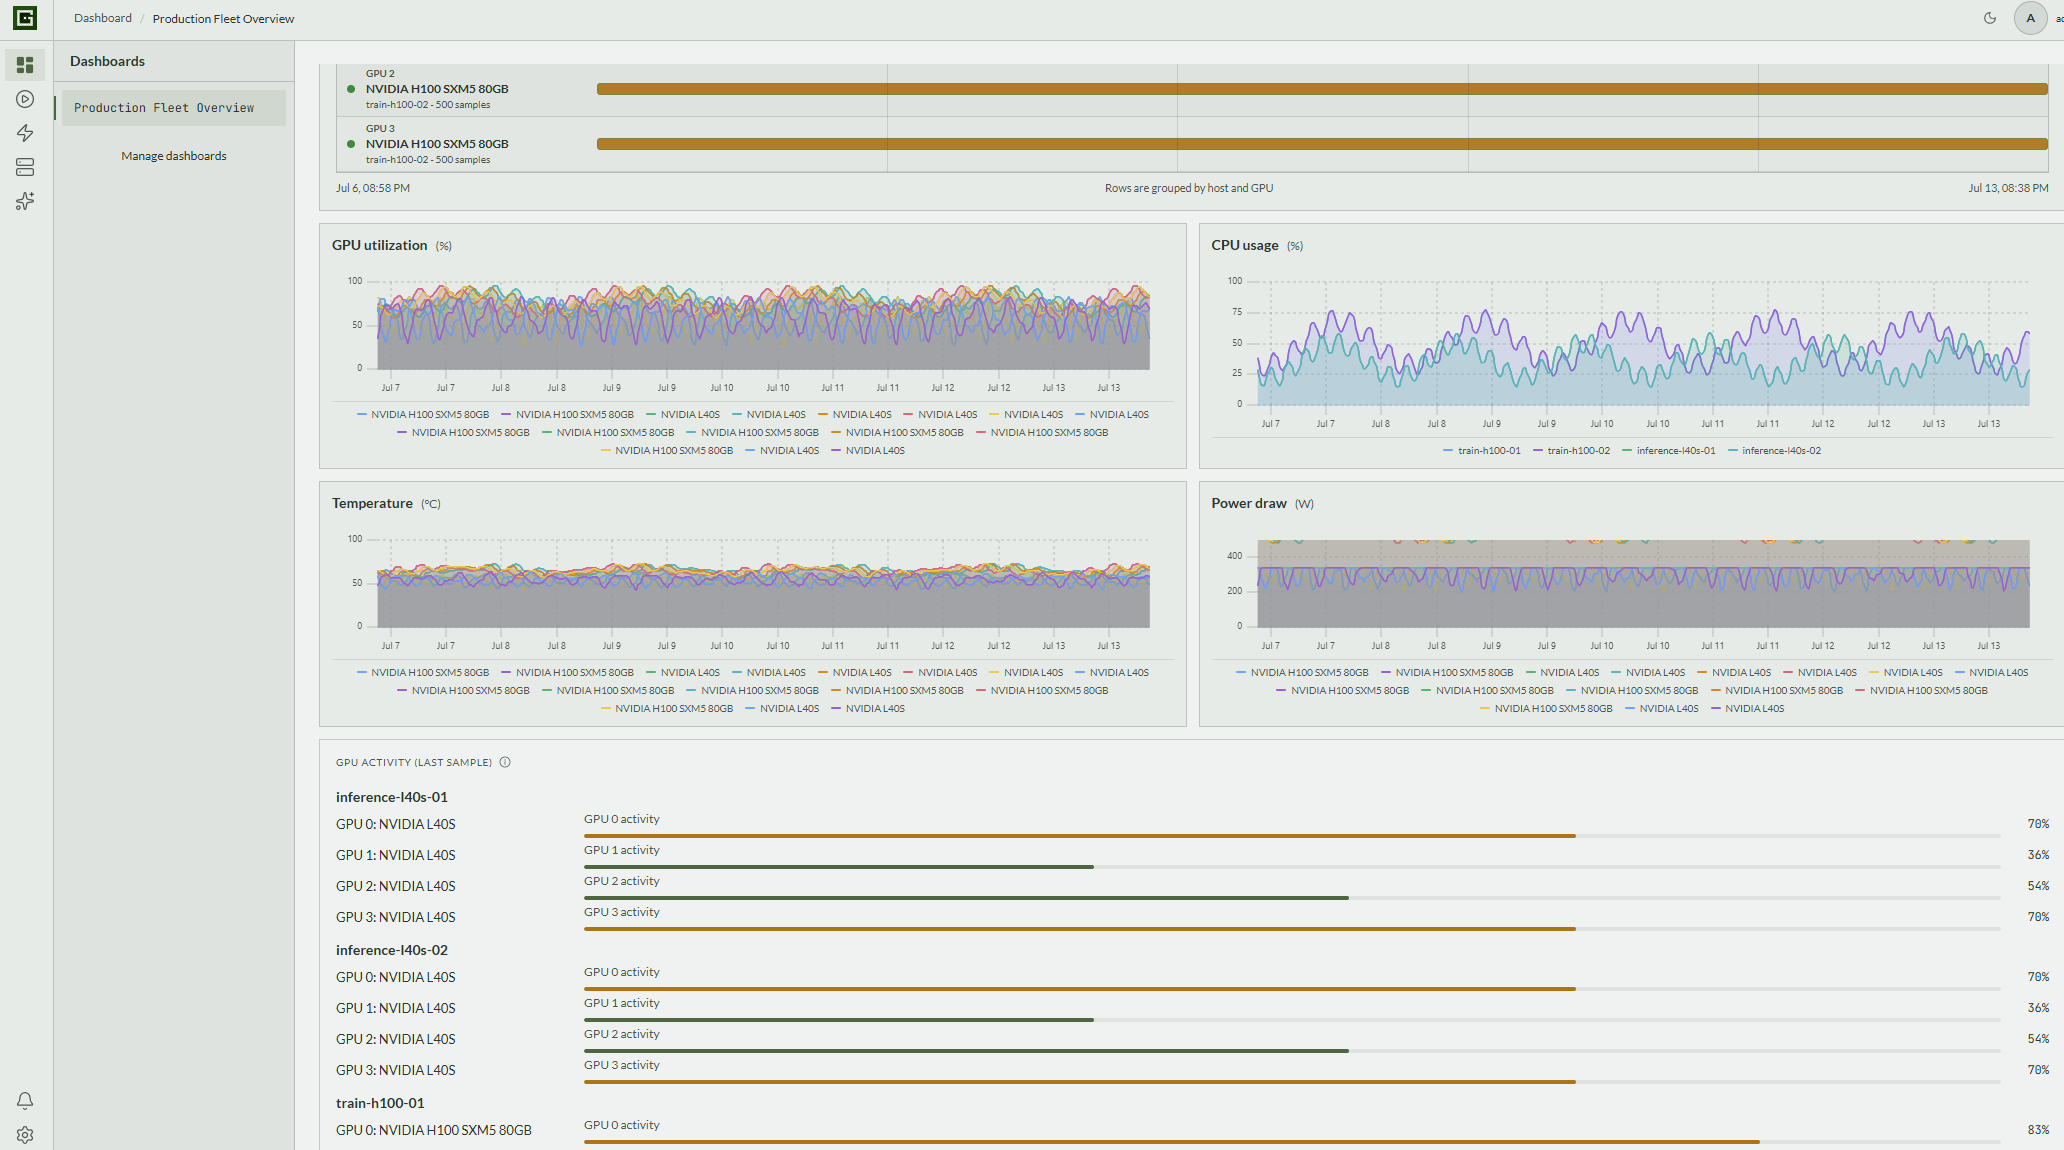
GPUFlight aligns GPU utilization, memory, temperature, power, host activity, and collection health across the same time window. Investigate one device or scan a fleet without treating a quiet chart as proof that everything is healthy.
Utilization needs context
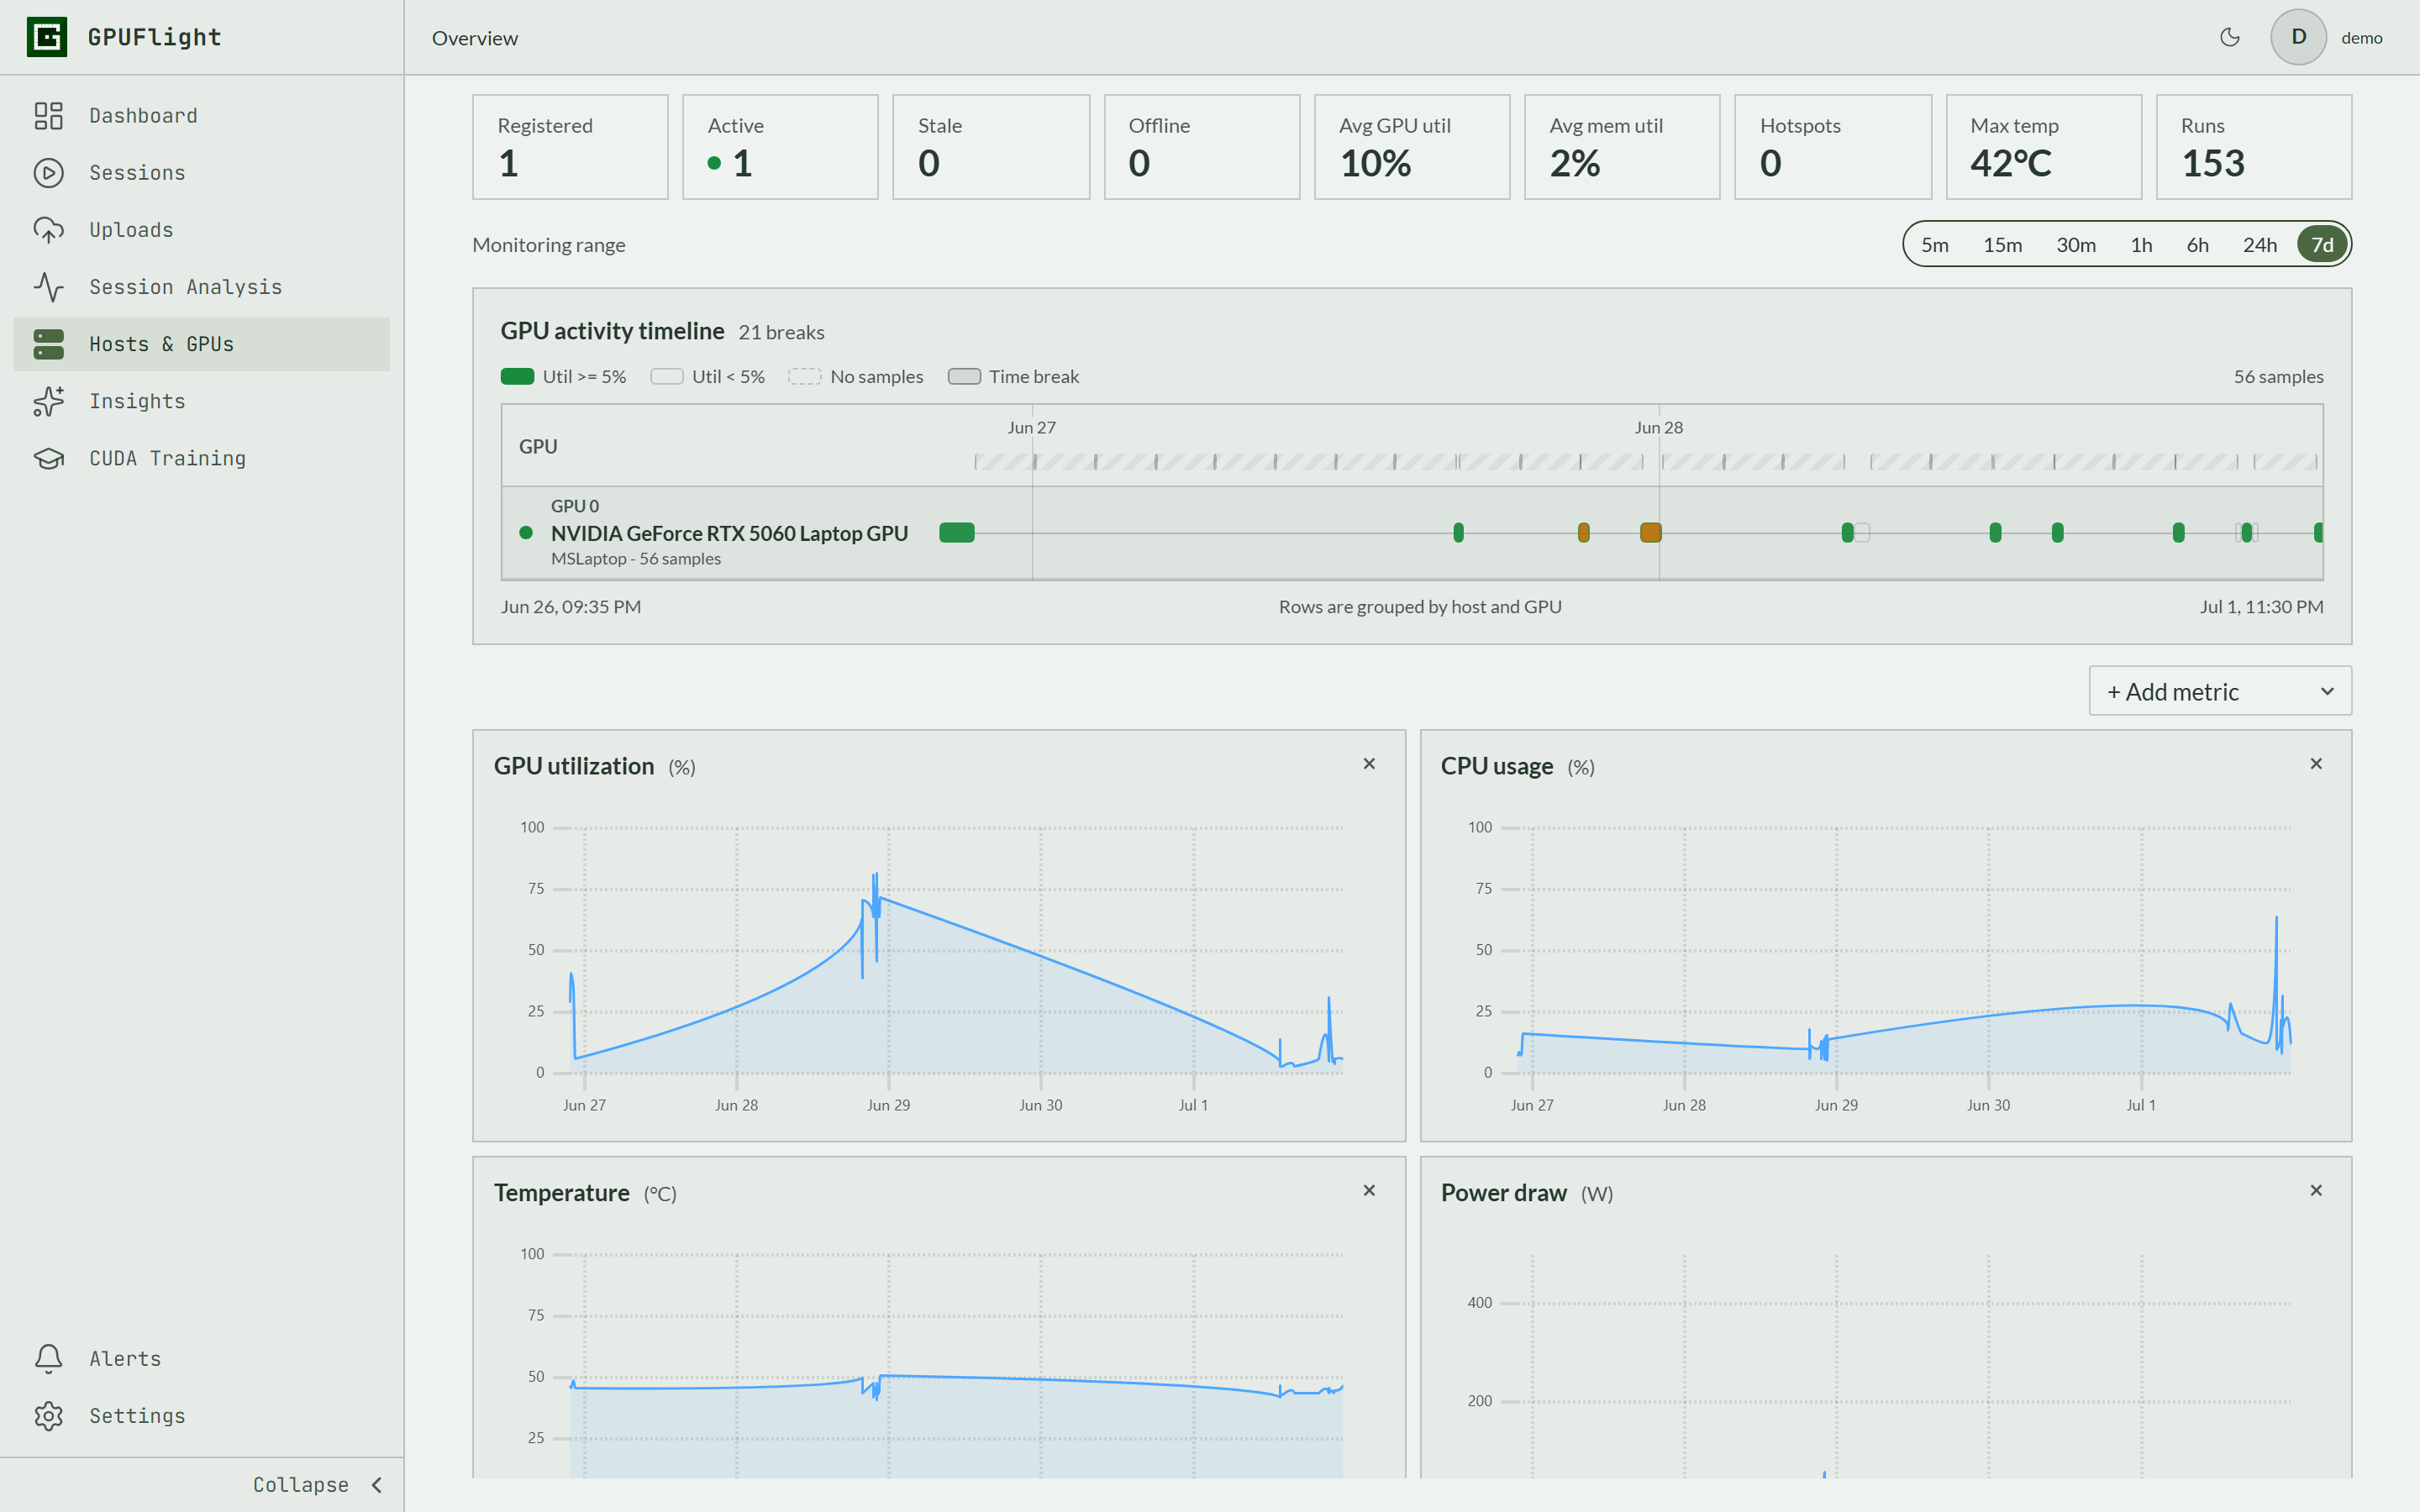
A zero or empty chart can describe several different situations: an intentionally idle GPU, a workload that is waiting on CPU or I/O, a collection gap, an offline host, or a monitoring process that stopped reporting. GPUFlight represents activity states and time breaks explicitly so missing data does not silently look like low utilization.
Bring GPU and host measurements into the same investigation. CPU saturation, host-memory pressure, temperature, power limits, and uneven device activity can explain behavior that a GPU-utilization percentage cannot explain by itself.
Fleet signals
Move from a fleet summary into the host, device, metric, and time range behind it.
See how consistently each device performs useful work and where activity is uneven.
Track memory used and memory-controller activity alongside the workload timeline.
Find thermal and power behavior that may limit performance or indicate operational risk.
Identify upstream resource pressure that can leave an otherwise healthy GPU waiting.
Separate low utilization from no samples, stale devices, and explicit time discontinuities.
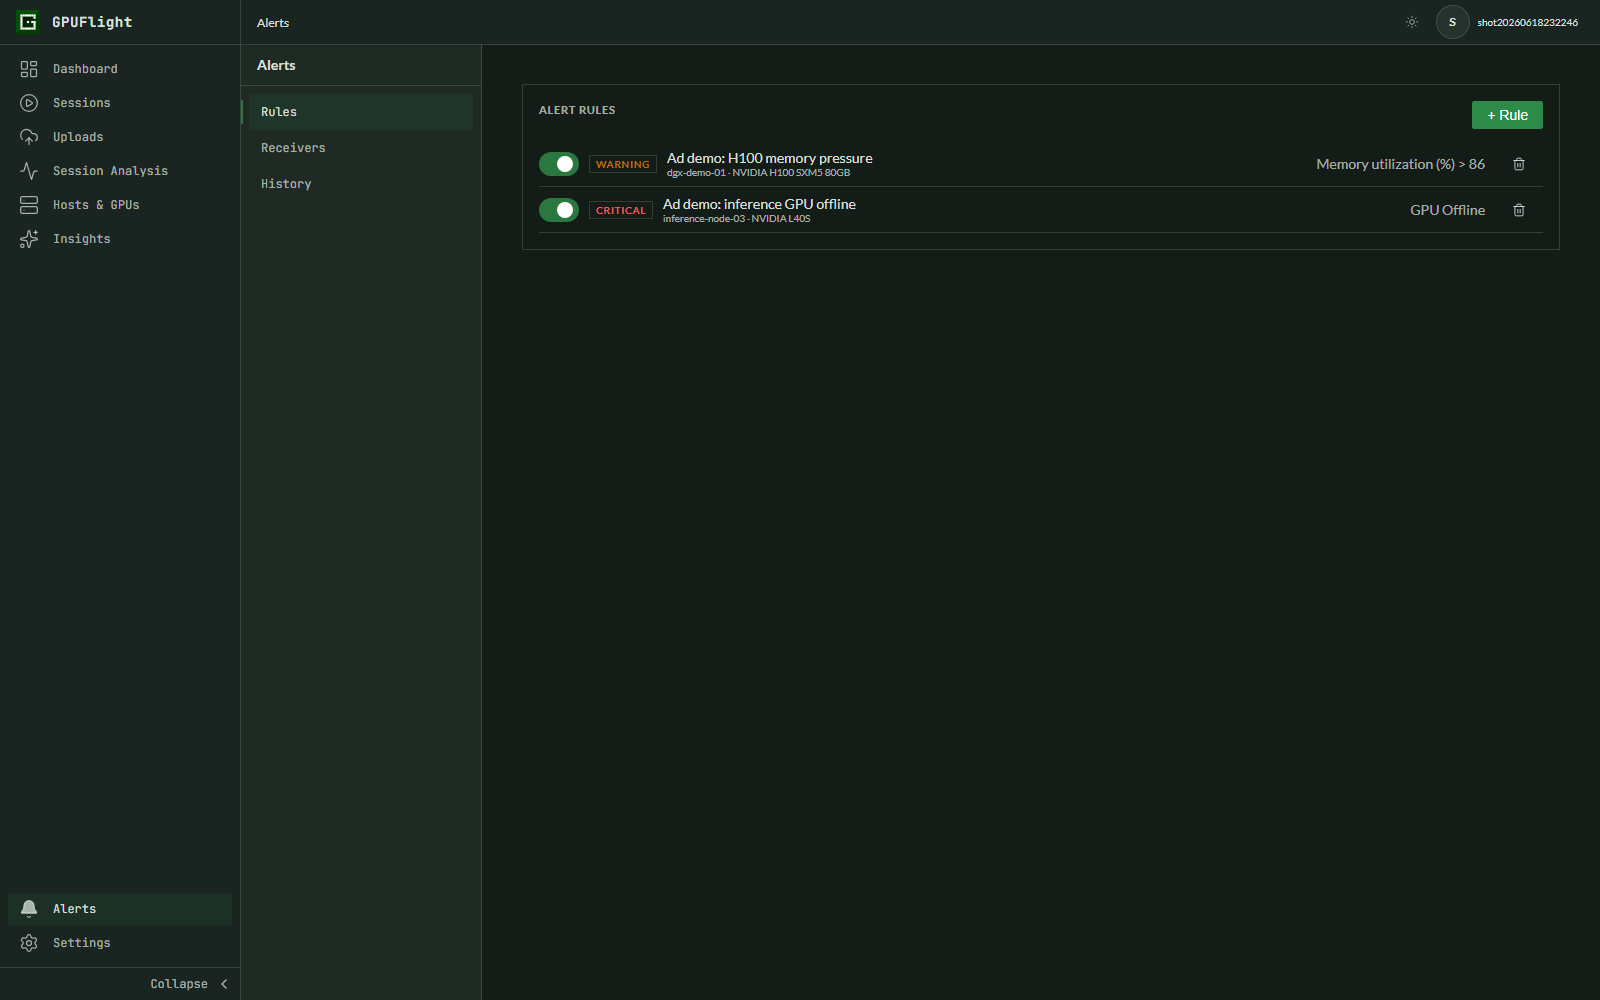
Define threshold rules, route notifications, and retain the event context for investigation.
One timeline
GPU utilization, CPU load, memory, temperature, and power often tell different parts of the same story. GPUFlight dashboards keep panels on a shared time range so an operator can compare changes without manually lining up separate monitoring tools.
From symptom to profile
Monitoring shows when a device or workload behaves unexpectedly. Profiling explains the CUDA or ROCm execution behind a specific run. GPUFlight keeps both workflows in one product so a fleet-level symptom can lead into a detailed kernel, memory, source, or timeline investigation instead of ending at a generic utilization chart.
Explore the deeper development workflow in the CUDA profiler.
Common questions
GPUFlight supports NVIDIA and AMD monitoring paths. Available fields and deeper profiling capabilities vary with the vendor, driver, and collection environment.
Yes. The fleet views group devices by host and allow investigation across multiple registered systems within plan limits.
A command-line snapshot is useful for one moment on one host. GPUFlight retains time-series history, aligns related metrics, represents collection gaps, and adds dashboards, alerts, and profiling context.
GPU monitoring is collected by the monitoring service rather than requiring every application to use the profiling SDK. Profiling can be added separately when deeper workload evidence is needed.
Build a trustworthy GPU timeline
Create a workspace, connect the monitoring service, and see device activity in the browser.
Start monitoring