Edit a CUDA project
Work with CUDA C++ source files in the browser and save each meaningful revision.
CUDA playground with built-in profiling
Write CUDA C++ or Python with Numba, compile and execute it on a managed NVIDIA GPU, and inspect the kernels, memory transfers, and timeline produced by the same run. You only need a browser—no local GPU or CUDA Toolkit.
See the workflow
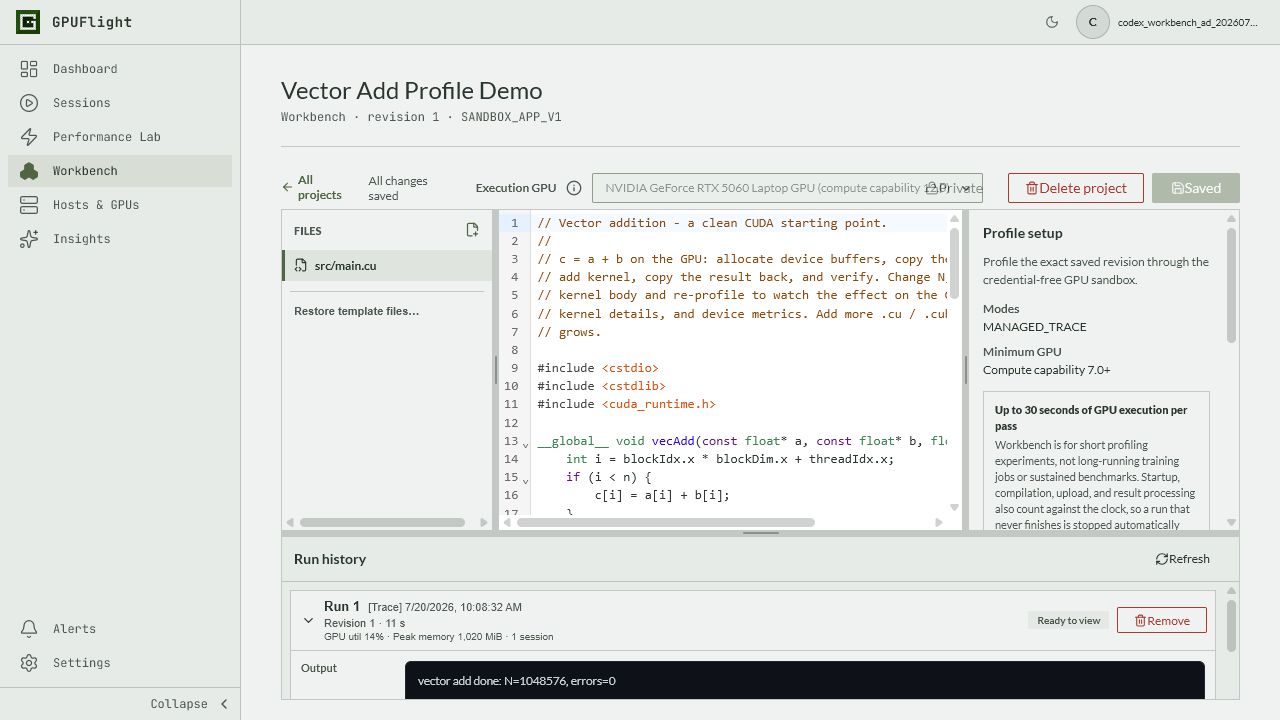
This short capture shows the complete loop: edit a CUDA program, run it on the managed GPU, verify the output, and open the profile created by that execution.
One connected workflow
A basic CUDA playground tells you whether a program compiled and what it printed. Workbench preserves that familiar edit-and-run loop, then connects the result to GPU execution evidence. You can see which kernels launched, when memory transfers occurred, how long the work took, and what changed between source revisions.
This makes Workbench useful for focused CUDA programming exercises, small reproductions, and performance investigations. It is not a general-purpose GPU rental environment: runs execute inside a restricted sandbox and stop after a short execution window.
If you are learning performance concepts rather than bringing your own program, start with the CUDA performance guides or a guidedPerformance Lab experiment.
How it works
Keep the program, run output, and profiling evidence in one project history.
Work with CUDA C++ source files in the browser and save each meaningful revision.
Execute the saved revision in a managed NVIDIA GPU sandbox and capture its output.
Connect the output to kernel launches, memory copies, NVTX ranges, and timeline data.
What you can inspect
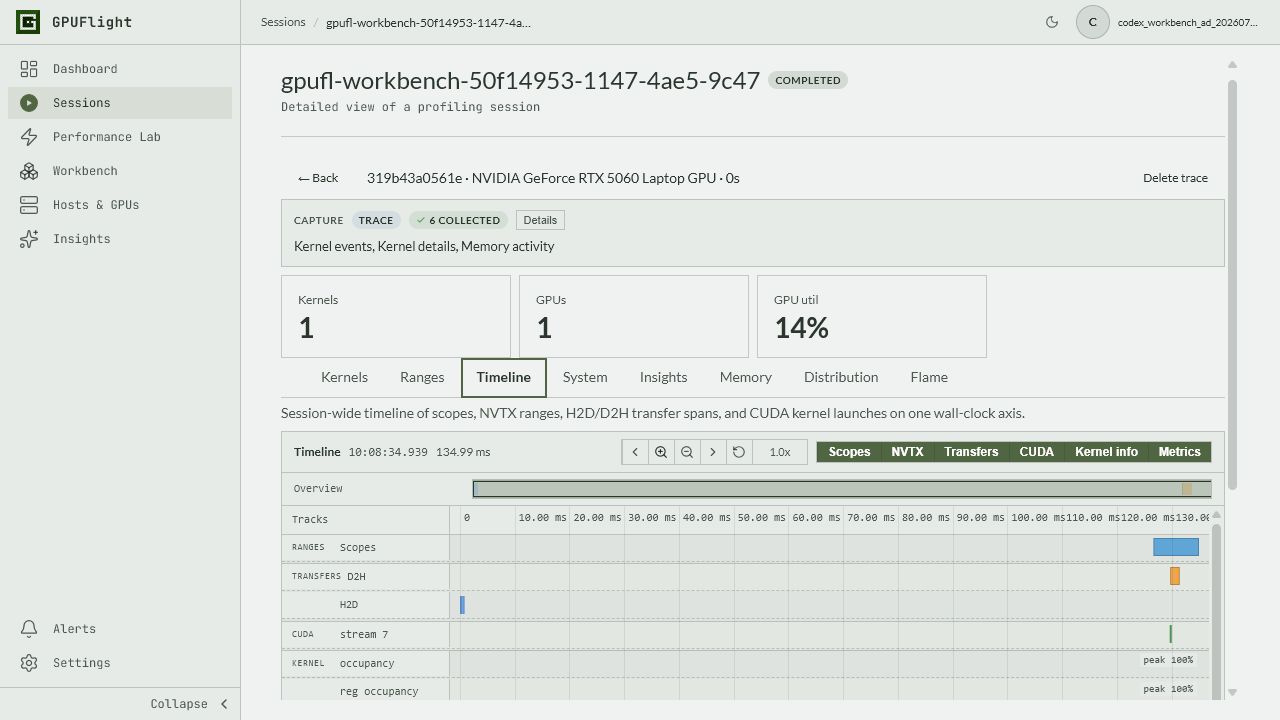
The Trace pass captures the execution sequence behind a successful run. Paid plans can add deeper isolated passes for measured metrics, SASS, and PC sampling when the project and GPU support them.
Choose the right starting point
Use Workbench when you have a CUDA experiment of your own and want to connect its output to profiling data. Use Performance Lab when you want a guided problem with a target, explanation, and known optimization path. Both use the same core idea: make a small change, run it on real hardware, and verify the effect.
Common questions
Workbench supports CUDA C++ projects and Python experiments with Numba. Available templates and profiling passes depend on the current plan and sandbox configuration.
No. Compilation and execution happen in GPUFlight's managed environment. You only need a supported browser.
No. It is designed for short CUDA experiments and profiling runs. Sandboxing and execution time limits protect the shared environment.
The free plan includes 1 Workbench project with Trace profiling and monthly GPU credits shared between Workbench and Performance Lab. Every hosted GPU run uses credits, with no daily run limit. CPU-only lessons and profiling your own hardware use no GPU credits. H100 requires a paid plan. See the plan comparison for details.
Yes. A completed profile can include kernel launches, transfers, NVTX ranges, and a visual timeline. Available deeper passes depend on the plan and workload.
Run a focused experiment
Create a free project, run it on managed NVIDIA hardware, and inspect the result.
Open the CUDA playground