Built for GPU engineers
Every feature you need to understand, optimize, and monitor your GPU workloads.
Everything you need to understand your GPUs
From kernel-level profiling to fleet-wide monitoring, in one platform.
Kernel Profiling
Automatic GPU kernel instrumentation for NVIDIA (CUPTI) and AMD (ROCm). Capture execution time, occupancy, register usage, and limiting resources for every kernel launch.
SASS Disassembly
GPU instruction-level analysis with PC Sampling and SASS metrics. See exactly where your kernels spend cycles, down to individual assembly instructions.
Real-time Monitoring
Always-on GPU utilization, temperature, power, memory, and fan speed tracking via NVML. Sub-second resolution. Negligible host-side overhead, safe to leave on 24/7.
Logical Scoping
Group kernels by training epoch, inference batch, or any logical boundary with GFL_SCOPE. See exactly which code path launched each kernel.
Fleet Overview
Monitor all GPUs across your cluster in one dashboard. Per-host, per-device views with stale session detection and thermal health gauges.
AI Insights
Automatic detection of low occupancy, memory bottlenecks, and suboptimal kernel configurations. Actionable recommendations, not just data.
Kernel-level visibility
GPUFlight captures every GPU kernel launch via CUPTI (NVIDIA) and ROCTracer (AMD). For each kernel, you get: execution time, grid and block dimensions, register usage, shared memory, occupancy breakdown, and the limiting resource. No sampling bias, no missed launches.
Instruction-level profiling
Go deeper with PC Sampling and SASS metrics. See which GPU assembly instructions cause stalls, identify memory bottlenecks at the warp level, and understand divergence patterns. All without recompiling your kernels.
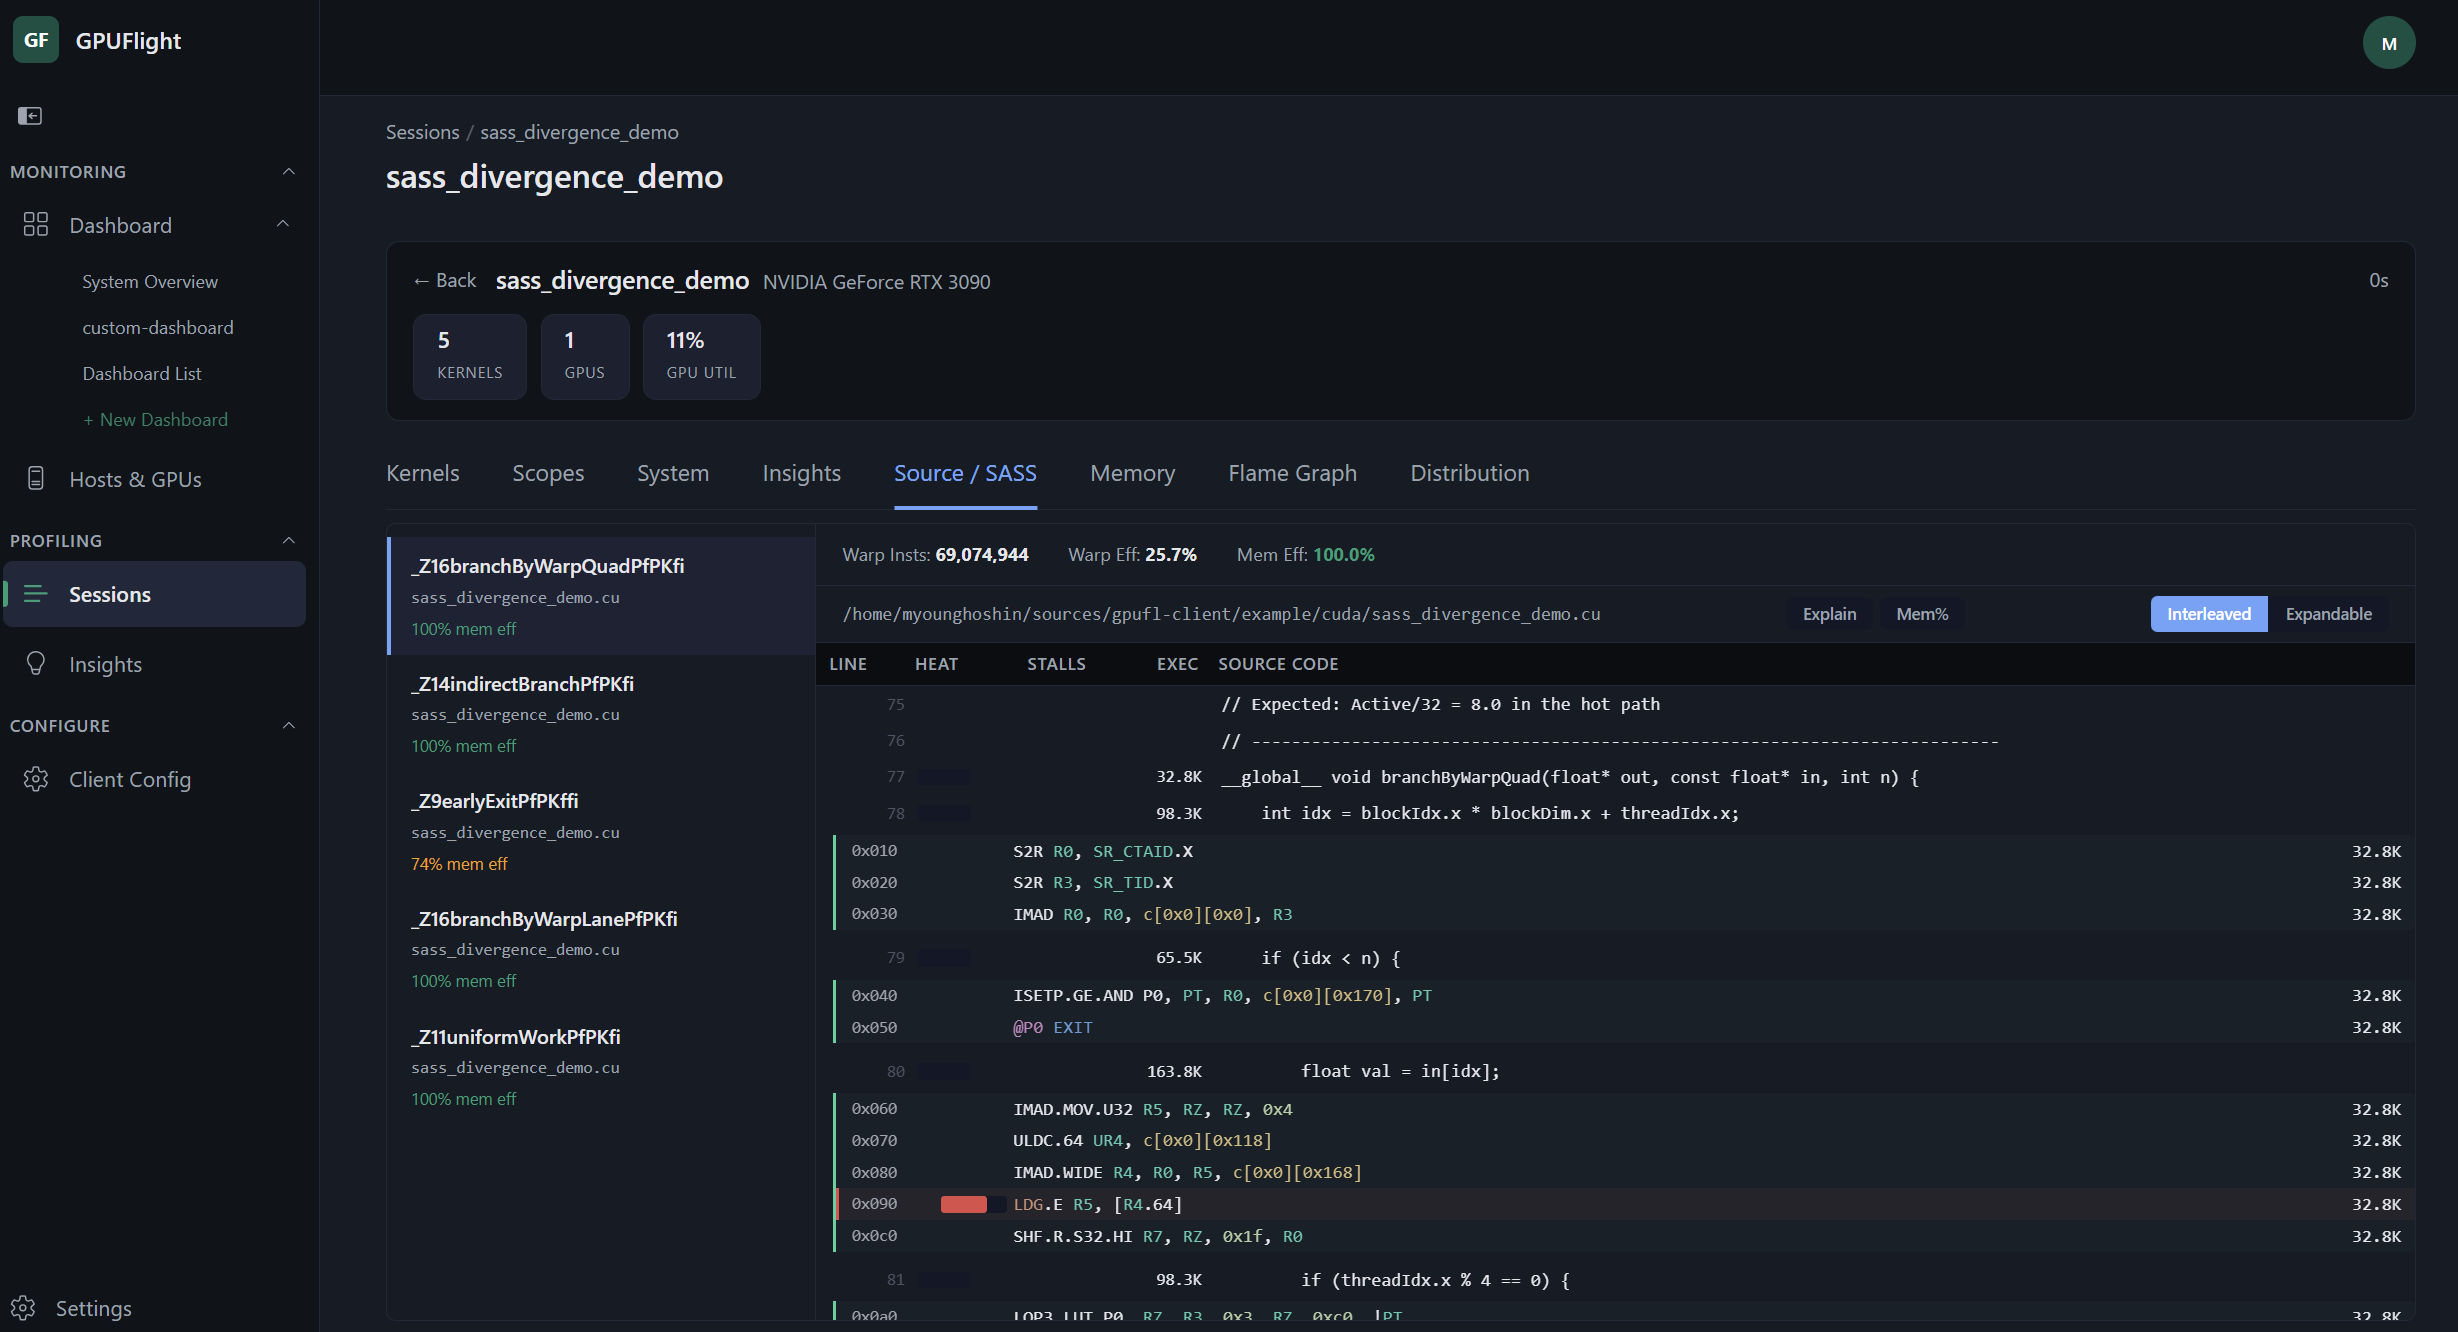 Source lines interleaved with SASS instructions, with per-line heat map and execution counts.
 Memory access analysis
Every memory instruction is scored by access pattern. Coalescing efficiency, cache line utilization, and wasted-bandwidth detection surface the exact load or store that's burning DRAM sectors — with a plain-English recommendation for how to fix it.
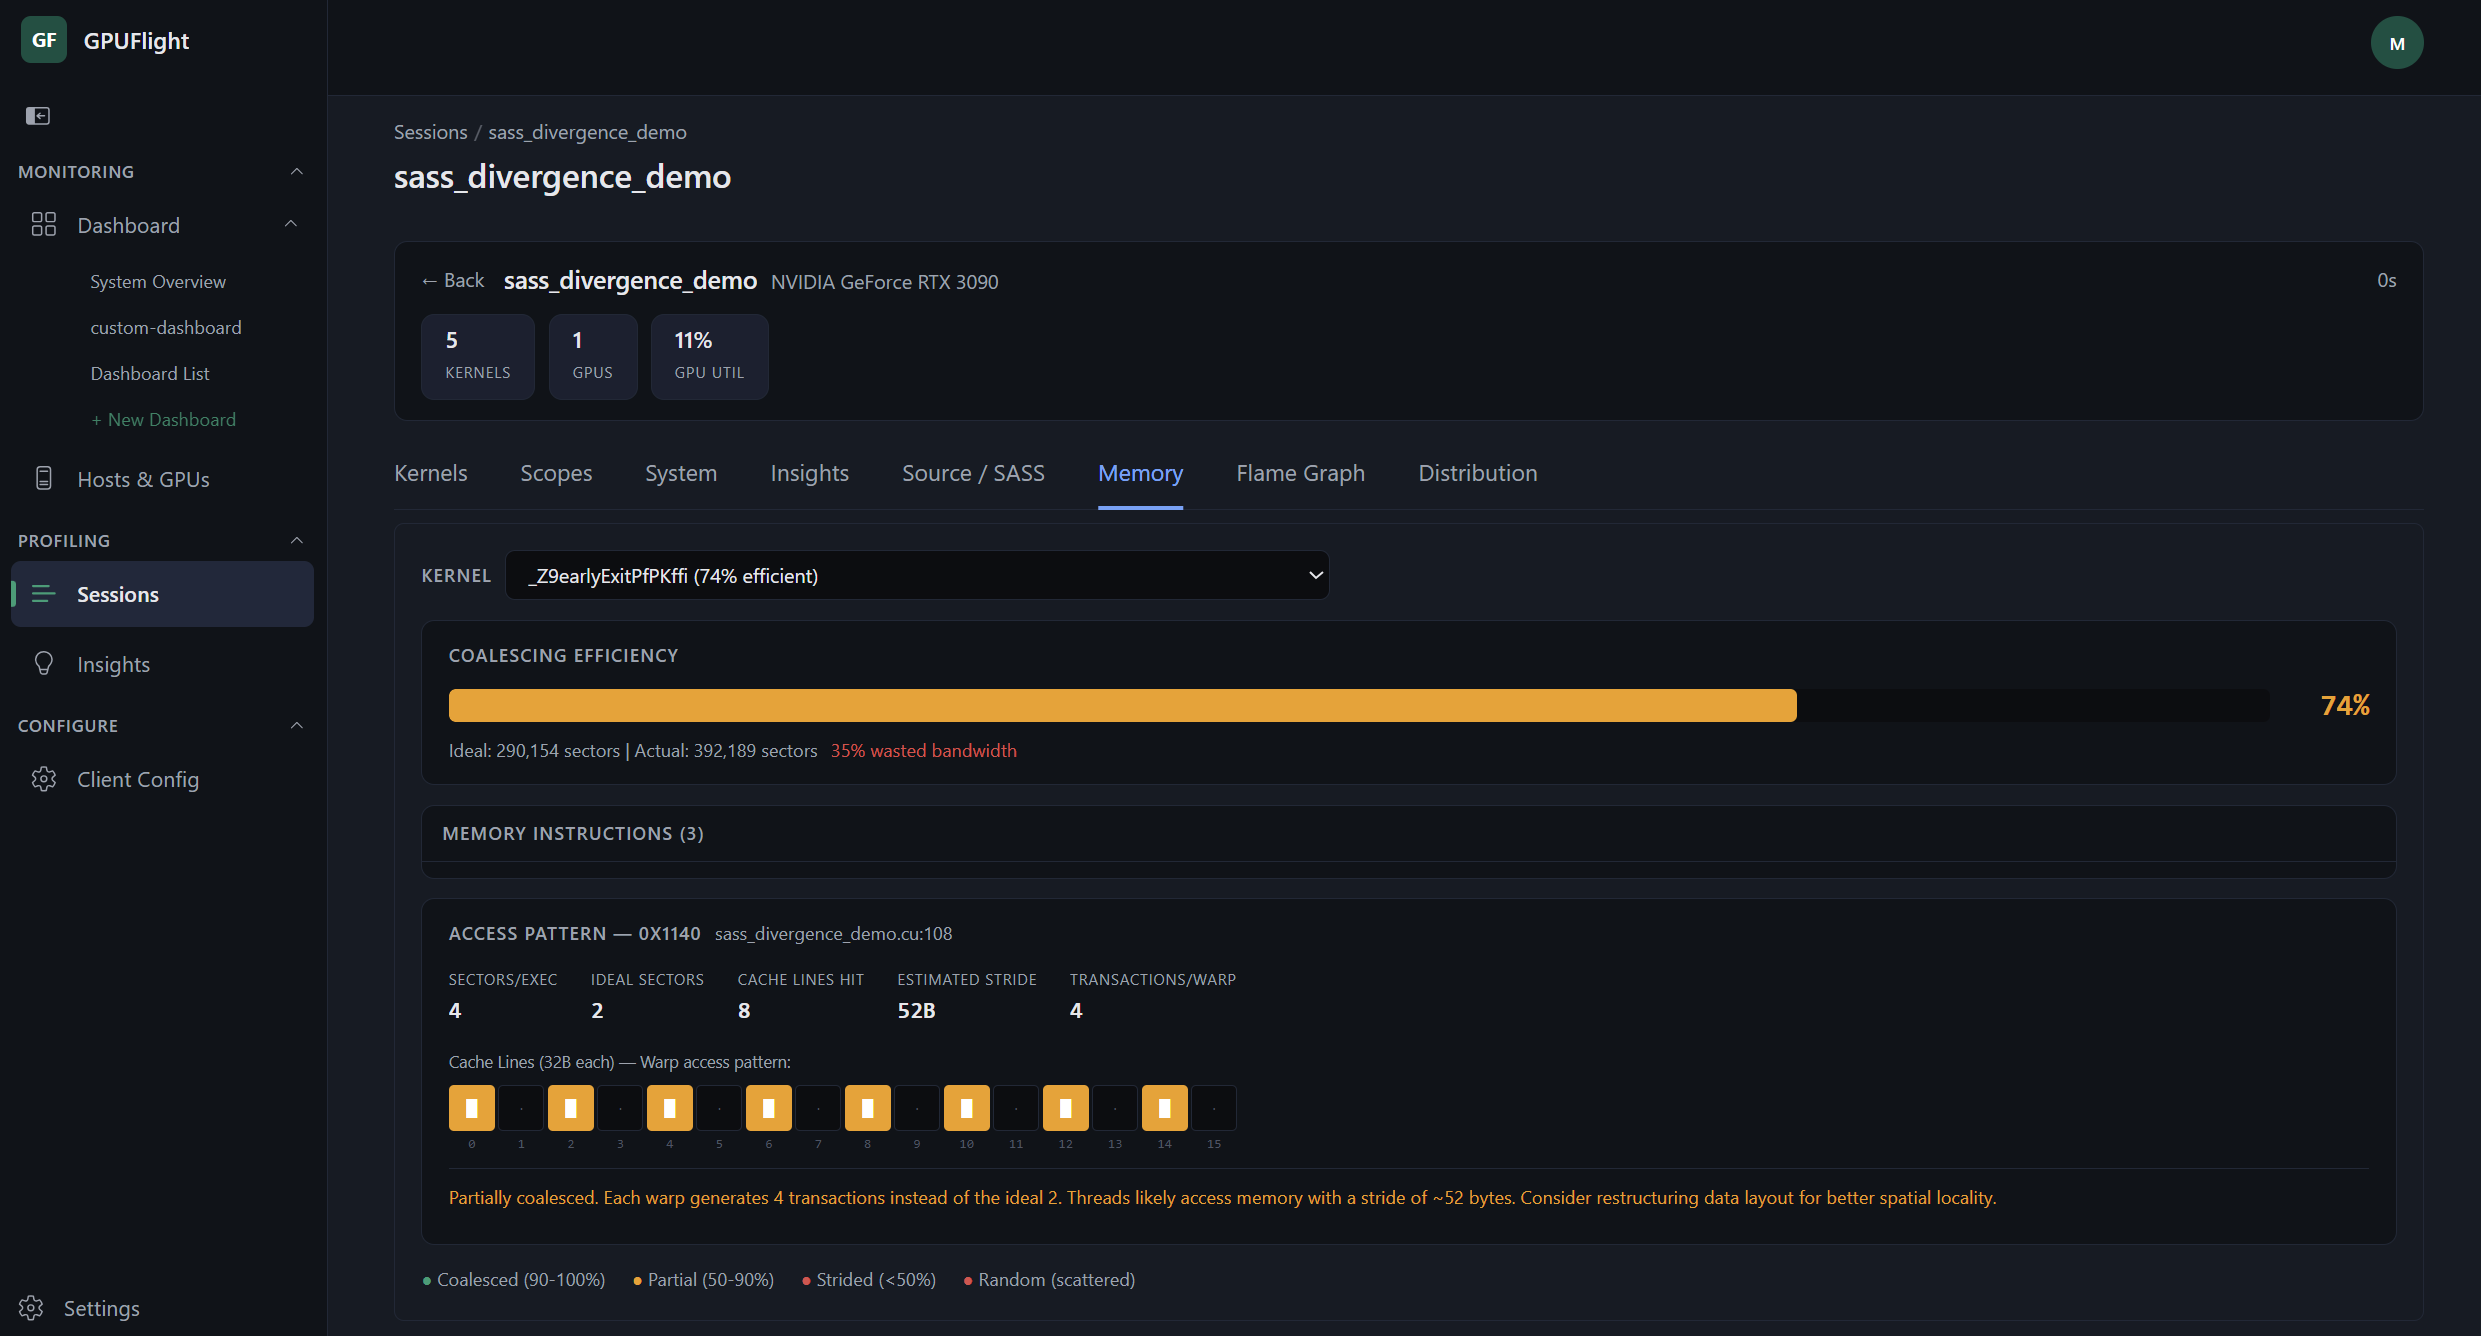 Coalescing efficiency per kernel with cache line access visualization and wasted-bandwidth flags.
 Automatic insights
GPUFlight doesn't just hand you raw numbers. Every session is scanned for divergence, low occupancy, stall hot spots, and memory inefficiencies — then ranked by severity with direct links to the source file, line, and PC offset. Findings, not dashboards.
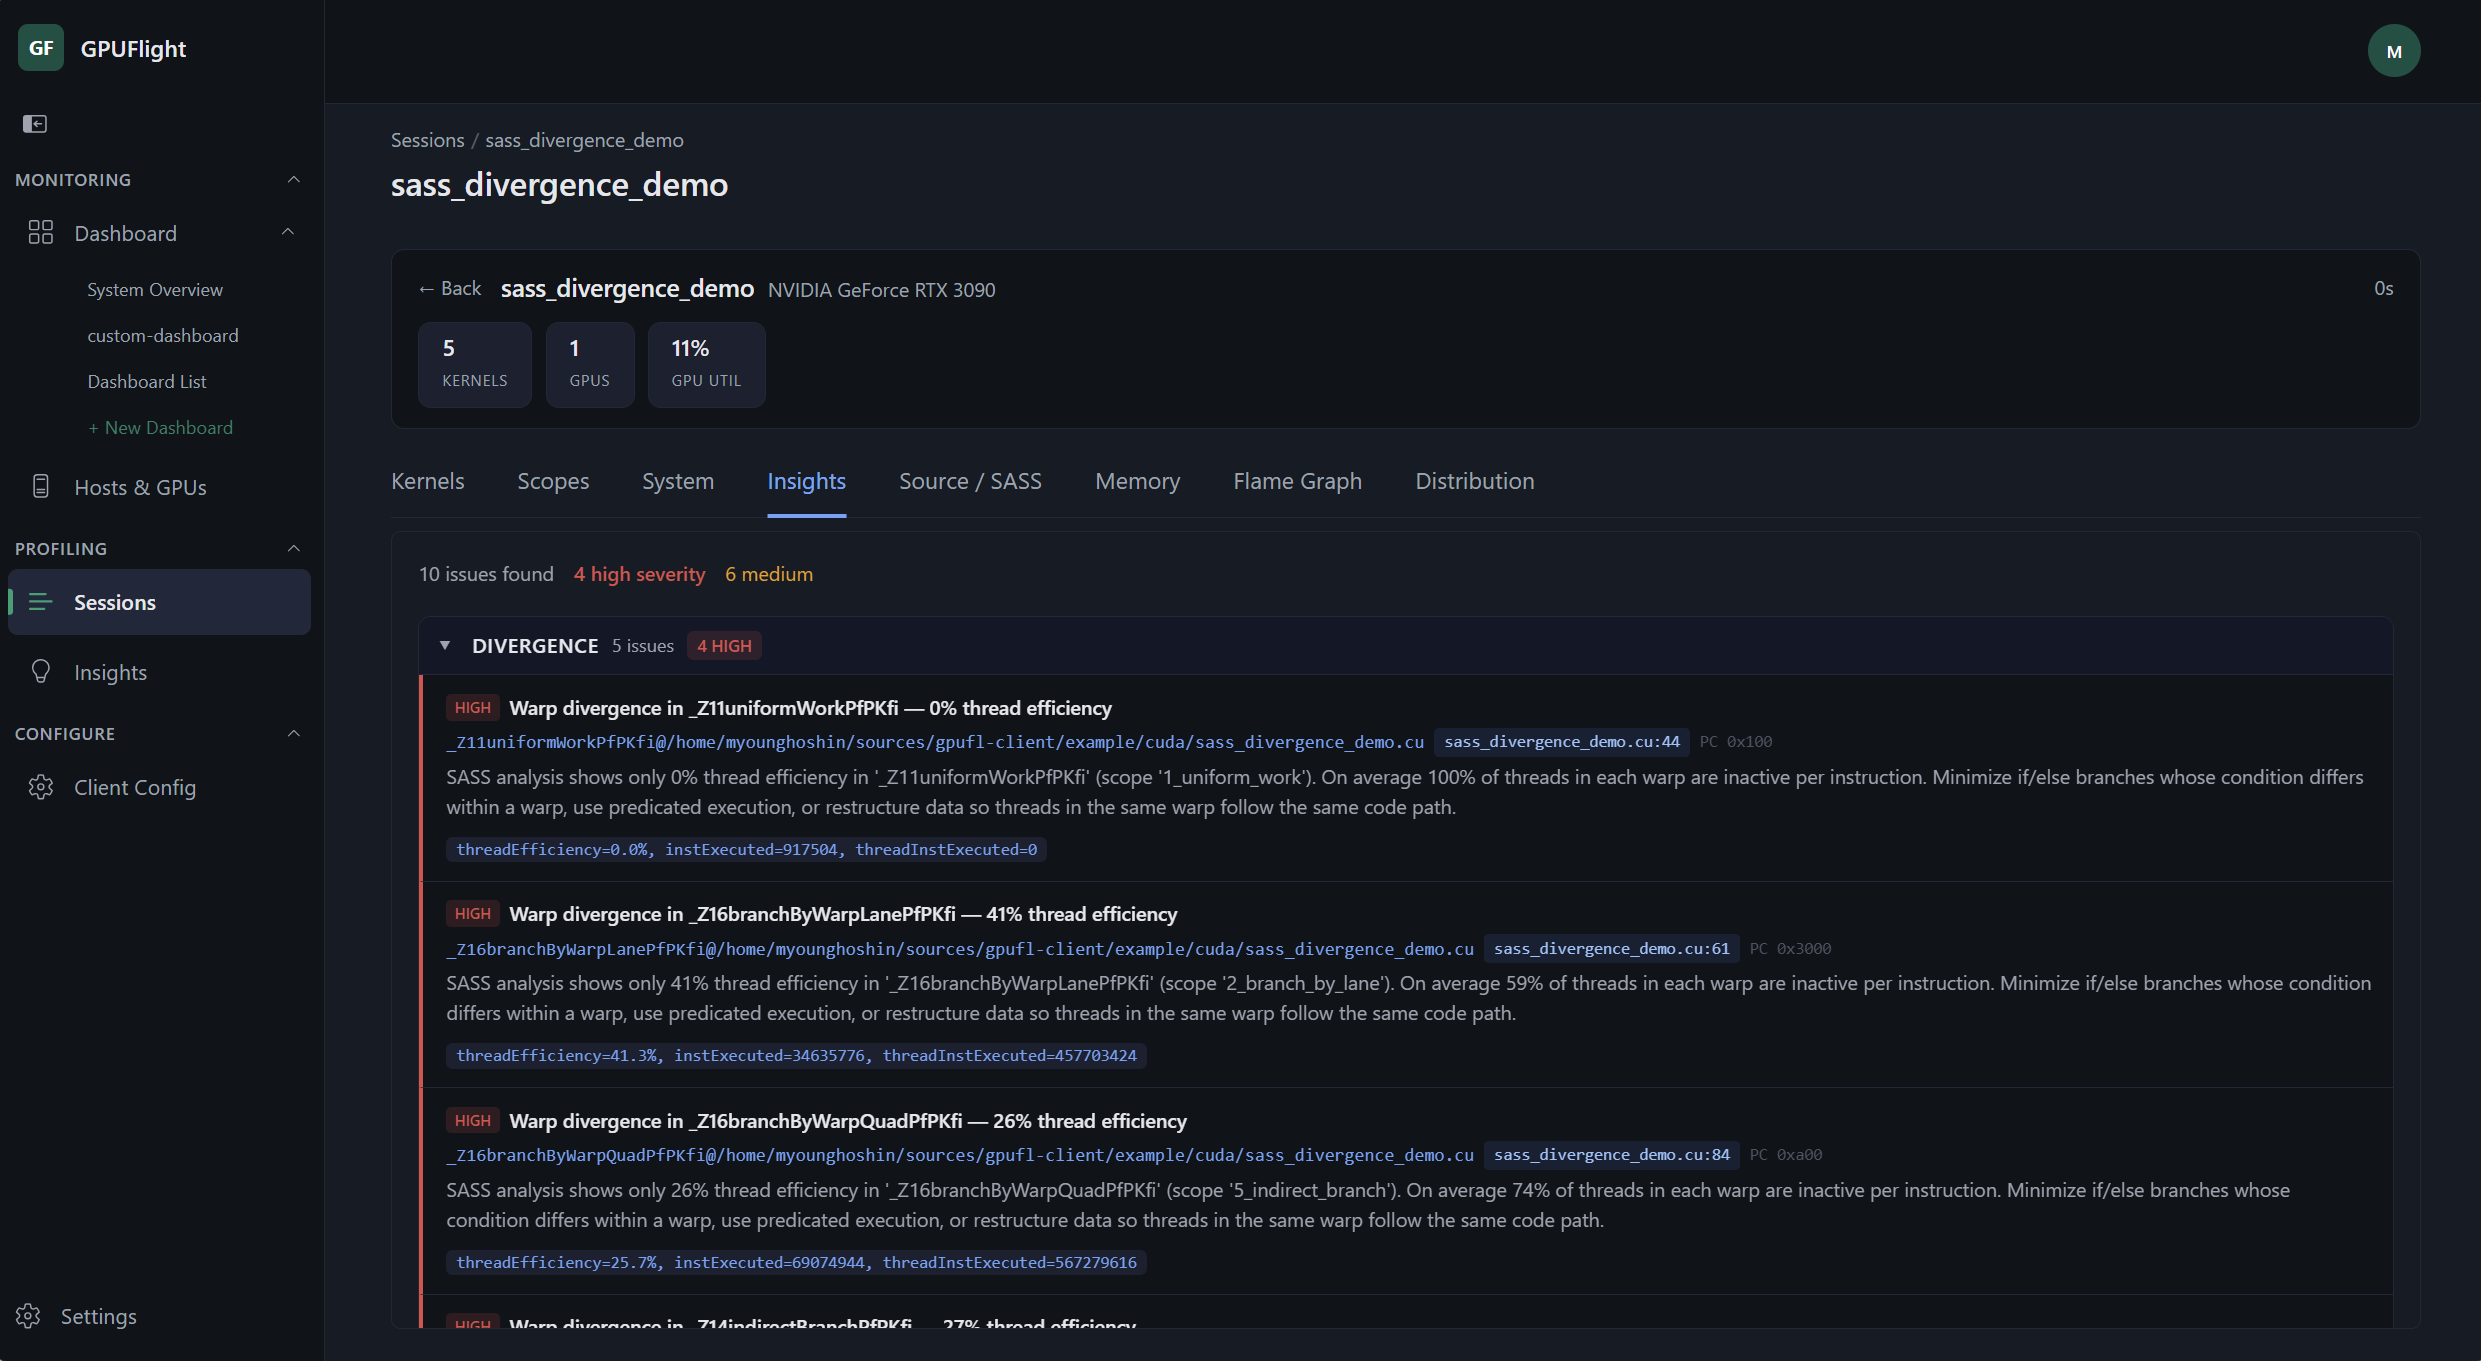 Automatic issue detection ranked by severity, with exact source locations for each finding.
 Always-on monitoring
The monitoring daemon collects GPU utilization, temperature, power draw, memory usage, and fan speed via NVML at sub-second intervals. Zero overhead on your compute workload. See trends across hours or days.
Fleet management
Monitor all GPUs across your cluster from one dashboard. Per-host summaries, per-device drill-downs, stale session detection, and thermal health gauges. Know exactly which machines need attention.
Start profiling in minutes
Free tier: 1 GB data ingestion per month. No credit card. NVIDIA or AMD.